
Multiple areas of crisis see workers’ rights crumble
Key measures of abuse of workers’ rights have reached record highs, according to the 2022 edition of the International Trade Union Confederation’s (ITUC) flagship Global Rights Index
Multiple areas of crisis see workers’ rights crumble
Key measures of abuse of workers’ rights have reached record highs, according to the 2022 edition of the International Trade Union Confederation’s (ITUC) flagship Global Rights Index
Economic integration of refugees into their host country is important and benefits both parties
Refugee migration has increased considerably since the Second World War, and amounts to more than 50 million refugees. Only a minority of these refugees seek asylum, and even fewer resettle in developed countries. At the same time, politicians, the media, and the public are worried about a lack of economic integration. Refugees start at a lower employment and income level, but subsequently “catch up” to the level of family unification migrants. However, both refugees and family migrants do not “catch up” to the economic integration levels of labor migrants. A faster integration process would significantly benefit refugees and their new host countries.
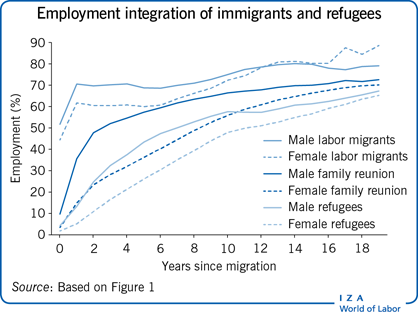
Refugees start at a lower employment level upon arrival in host countries but subsequently “catch up,” economically, with family reunion migrants.
Internal migration (i.e. within the host country) of immigrants in general, and of refugees in particular, is an important factor for obtaining employment.
Similar labor market results (e.g. employment and income levels) are obtained for male and female immigrants in a number of different countries.
Results from current research seem robust, since comparable outcomes are obtained when investigating various national labor markets.
Refugees integrate more slowly into host countries’ labor markets compared to labor migrants, due to not being primarily selected for host country labor markets.
Loss and depreciation of human capital and credentials during asylum procedures and lower health levels hinder refugees’ integration.
Introduction and settlement policies do not adequately help refugees attempting to integrate into the host’s labor market; this contributes to their poorer economic performance, particularly in the first few years after arrival.
Refugees’ less effective adaptation to the host country’s labor market leads to increased individual and societal costs.
Refugees have often lower employment rates and income levels than family reunion migrants and labor migrants, but over time this gap diminishes or disappears altogether. Non-selection for the labor market, depreciation of human capital and credentials due to the asylum and skill accreditation processes, as well as inferior health levels are important reasons for the slower adaption process. Given the current and future increasing inflow of refugees into developed welfare states and to diminish individual and societal costs, more in-depth knowledge about the integration of refugees into a host country’s labor market, including policy evaluation, should be prioritized.
According to the United Nations High Commissioner for Refugees (UNHCR), the number of refugees on the move, that is, forcibly displaced persons, has crossed the 70 million mark, roughly the population of the UK. Civil war, international conflicts, ethnic conflicts, and human rights abuses are the main causes of this movement. UNHCR also estimates that approximately half of all refugees are found in urban areas, one-third in camps, and the rest in the countryside. Moreover, 84% live in developing countries. Among these, UNHCR has identified one million individuals as displaced.
Only a small portion of the world’s refugees has managed to seek asylum in developed countries and find some kind of sanctuary. Although the number of people needing protection has increased dramatically, the current asylum system has become controversial in Western countries, spurring a heated political debate. Two related questions have fuelled this debate. The first question is: how can potential refugees seek asylum in a humanitarian and safe way? The second is connected to the host societies: to what extent do they want or are they able to welcome newcomers, offer them protection, and subsequently integrate them into society? The second question is examined in more detail in the following, as it deals specifically with the labor market integration of refugees in host countries. The labor market integration of immigrants has been a subject of academic interest for some time and is increasing. However, due to data limitation, a limited number of countries have analyzed labor market integration by intake categories, which would allow distinction between groups such as labor migrants, refugees, family reunion migrants, and so on. This article discusses the labor market trajectories, employment, and income of refugees in Western countries in relation to labor migrants and family reunion migrants as well as the sub-category of resettled refugees.
Although a large body of literature is available on the economic integration of immigrants in host countries, limited studies have been conducted specifically on the economic integration of refugees. Since the Second World War, the establishment of the UNHCR in 1949, and the 1951 Refugee Convention, the number of people seeking asylum has had a profound effect on OECD countries. Over the last three to four decades, these countries have had to deal with increasing numbers of refugees from around the globe.
One obvious question is: do refugees integrate easily into the host countries’ labor markets? Other questions relate to the extent to which they are able to reach the same levels of employment as other immigrant categories or the native population, and what the income trajectories of refugees look like compared to natives and other categories of immigrants.
Currently a number of studies in countries such as the US, Canada, Australia, the UK, the Netherlands, Switzerland, Denmark, Norway, Germany, and Sweden have focused specifically on the labor market integration of refugees. Compared to other immigrant categories, refugees generally have lower employment rates, especially when measured shortly after arriving in the host country. However, over time, refugee immigrants “catch up” and show similar employment levels as other non-economic immigrant categories [1], [2], [3], but still exhibit lower levels when compared to economic (labor) migrants [2], [4] (Figure 1). Moreover, the income trajectories for refugees appear similar to other non-economic immigrant categories [2], [4]. Though again, refugee immigrants lag behind labor migrants in terms of earnings development [5], [6], [7].
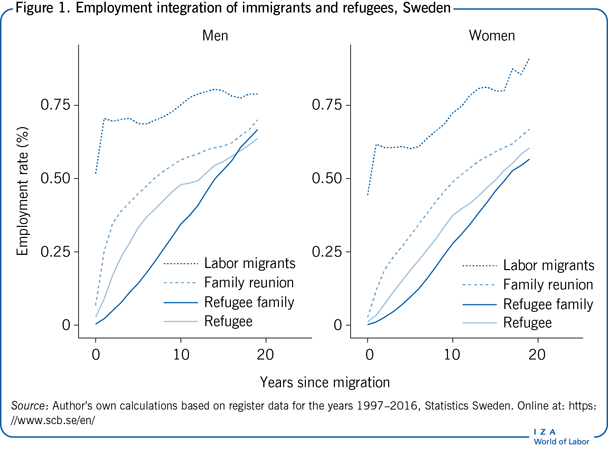
With respect to the economic integration of refugees as compared to other immigrants, differences such as age, marital status, gender, origin, and human capital characteristics (like education) as well as health status affect their economic integration.
Refugees, like family reunion immigrants, are less likely to be favorably selected for labor market integration (i.e. less likely to secure employment in the host country) when compared to labor immigrants. One of the reasons for this is that a number of countries that attract labor immigrants have created screening policies to ensure smoother labor market integration for them specifically. Other countries have policies to ensure that labor migrants are admitted entrance in order to match the demand for specific jobs available in the host country. Since refugees, as well as family reunion migrants, are not relocating primarily to seek employment, information on the host country’s labor market situation is of less importance for their move. Subsequently, a number of countries have developed integration policies aimed at refugees that are designed to enhance their labor market integration. An example of this is found in Sweden, where refugees are offered two years of “introduction” assistance, which includes language courses, general knowledge about Swedish society and the labor market, health screening, and evaluation and accreditation of earlier skills. It is important for both refugees and their host country that these measures are effective and that they lead to higher economic integration. However, it is noteworthy that very few refugee integration policies have been thoroughly evaluated, making it difficult to give conclusive recommendations for best practices.
In order to assess the labor market integration of refugees, detailed statistical information relating to immigrant categories is of crucial importance. However, this is not always easily accessible, given that some countries record very little registered data on the topic, while in others, the only reliable sources are survey information or proxies by country of birth and cohort of arrival.
Two key measures are considered in this article with regard to the labor market success of refugees: the employment levels of refugees, and refugees’ earnings. Both of these indicators are related to the labor market success of other immigrant categories.
There is reason to believe that refugees are treated less favorably than labor or family reunion migrants by their host countries. Furthermore, outcomes for refugees, economically speaking, differ from those of other immigrants. The fact that refugees arrive under different circumstances and are admitted using alternate criteria appears to affect their labor market integration. Moreover, as both the migration process and the admissions process can be drawn out and cumbersome, health issues and loss of human capital can hinder an individual’s ability to adapt to their host country’s labor market. The question then becomes, to what extent does policy hinder or help this process?
Research on the economic outcomes of migrants by entry category is still limited due to a lack of relevant data. For example, the existing national population data sets in Scandinavia include information on intake category reported by immigration authorities whereas those in other countries are based on self-assessed survey information reaching a limited number of individuals. Thus, quantitative assessments of outcomes by entry category are more reliable in those countries where national longitudinal data sets are available compared to countries that have to rely on surveys. However, a special database that exists for Canada allows for the direct comparison of economic integration by intake category for Canada and other countries with national longitudinal data [2], [8].
When examining immigrant outcomes in Sweden, for example, it can be argued that refugee integration into the labor market depends mostly on individual human capital, investment in schooling and education (both in the source and host country), and labor market experience in the host country. Furthermore, by utilizing national data to assess the impact of mobility on refugees’ economic outcomes in Sweden, it appears that internal migration (i.e. moving around within the host country) leads to higher overall family income for newly arrived refugee families. This can be partially explained by the fact that refugees frequently move from areas with few employment prospects to areas with greater opportunities. The internal migration of immigrants in general, and of refugees in particular, is thus an important factor when it comes to obtaining employment. Moreover, it has been shown that choice of city and the prevailing labor market situation are important predictors of labor market integration. Larger cities, for example, often have larger co-ethnic populations; there is thus greater opportunity to access ethnic networks, which are generally helpful for finding employment. So-called dispersal policies, policies that aim to randomly divide newly arrived refugees over a country or those based on non-economic factors, for example available housing, are less effective in integrating refugees into host country labor markets [9], [10].
A specific analysis of the employment integration and earnings trajectories of non-economic migrants to Sweden in comparison to Canada provides further insights [2], see also [4]. This is a worthwhile comparison to make because these two countries each accept relatively large numbers of immigrants, and because they both have specific policies designed for refugees as well as other immigrants. The employment rate for non-economic migrants is roughly the same in Canada and Sweden, although there are variations when it comes to country of birth. Differences in employment rates across intake categories and countries of origin are smaller in Sweden than in Canada. Refugees in Canada appear to be more successful than family reunion immigrants. By comparison, differences across intake categories in Sweden are relatively small. Earnings are shown to be higher in Canada than in Sweden for both males and females. Category of intake appears to make a difference for women in Canada, but not for men or women in Sweden. In both countries, refugee women earn more than family reunion women, while earnings for refugee men and family reunion men are more or less the same. In Sweden, the differences across intake categories for both employment possibilities and earnings are minimal [2].
In addition to national-level data sets, a number of special surveys have been carried out that support the relationship between immigrant entry category and economic outcomes. In the case of the Netherlands [3], it was found that host country-specific education, work experience, language proficiency, and contacts with natives are positively related to chances of employment and occupational status. For the UK, using Labour Force Survey data for the years 2010–2017, research shows that the labor market outcomes of refugees are worse compared to other migrant categories (work, education, and family) [7]. They are less likely to be employed and they earn less. The evidence from this study indicates that differences in health status, especially mental health, may be one of the factors that contributes to the differences in outcomes between categories.
Evidence from Canada using the Longitudinal Immigration Database (IMDB) has recently been used to assess outcomes for post-1981 refugees. They appear to do equally as well as family reunion immigrants in terms of earnings. Comparing the labor force participation and earnings of different categories of immigrants in Canada two years after their arrival, refugees are shown to have lower labor market participation rates than family reunion immigrants, but their earnings are about the same [8].
Recent assessments of economic outcomes in the US show that refugees earn less than other immigrants, but that this difference can be at least partially explained by differences in language ability, schooling, level of family support, mental health, and residential area [11]. However, a gap remains, even after controlling for these factors.
Finally, evidence from Germany shows that employment bans that prevent asylum seekers from entering the local labor market while waiting on their residence permit have negative effects on their economic integration [12]. Using a natural experiment based on a court decision reducing the length of the employment ban, this study shows that those who arrived before the decision were scarred and had considerably lower employment levels than those who came after the decision.
There are only a few studies that have assessed the labor market integration of so-called “resettled” refugees compared to asylum seekers, who subsequently obtain a residence permit, and family reunion migrants. Swedish studies show that not only is there a difference in employment integration between refugees and family reunion migrants, but variation also exists between subcategories of refugees (Figure 2) [2]. These differences may be a product of integration policies that vary by entry category. It may also be that access to networks and mobility choice varies between groups, contributing to the disparities among integration levels. Resettled refugees are often located in municipalities where housing is available but where employment opportunities are scarce. By contrast, asylum refugees often have personal resources, like social networks and financial means, which enable them to settle where job prospects are more promising. Family reunion immigrants are likely to draw on the networks acquired by family and friends who have already settled in the country, thereby improving their employment chances [2].
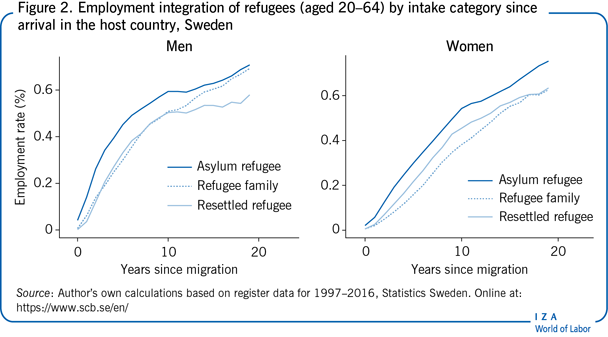
Much of the difference between refugees and labor immigrants has been attributed to the idea that refugees are disadvantaged from the start; they experience weaker economic integration and have difficulties catching up with other non-economic and economic migrants [4]. However, there are discrepancies in the results that purport this: a comparative study shows that with increased time in the country, refugees perform in some countries as well as or even better than other non-economic immigrants; in some countries the differences are small over time, while in other countries the gap remains substantial [4]. Explanations for these results vary from more general factors like language proficiency, level of education, and credential recognition, to more specific factors that highlight mental and physical health issues connected with asylum status, as well as to what extent the asylum-seeking procedure enhances (or hinders) the integration process [11].
In relation to this, several countries follow an introductory procedure that includes obligatory language courses that the refugees must pay for themselves, while others offer this service free of charge. Some countries provide settlement assistance, which includes labor market training and assistance with housing, whereas in others there is limited assistance. Moreover, refugees may obtain permanent residency in some countries, while other countries only allow temporary residency [13]. All of this can have a significant impact on immigrants’ behavior in the labor market and their subsequent economic integration.
The successful labor market integration of immigrants in host societies is a major political concern in many OECD countries. The increasing number of refugees who would like to be assimilated into these countries calls for extended research on this topic. Despite the availability of a huge body of literature on the economic integration of immigrants, there is still a gap when it comes to studying immigrants according to category of entry, especially the refugee category.
Current research about the economic integration of refugees in host countries could benefit from more in-depth investigations using longitudinal statistical information, specifically regarding pre-migration conditions as well as to what extent various policies affect refugees’ short- and long-term integration into host economies.
Future research should thus focus on the accumulation of statistical data for each immigrant entry category and the analysis of specific pre- and post-migration aspects of a successful labor market integration of refugees. Longitudinal statistical information that makes it possible to follow individuals over time is of crucial importance to assess the labor market entrance, as well as the occupational and income mobility of refugees versus other immigrant categories and the native population. Comparative country research is also necessary in order to assess whether refugee integration policies are efficient and if they induce the desired effects.
The labor market integration of refugees in a number of OECD countries shows that, in comparison to other immigrant categories, refugees have a slower start but subsequently “catch up” with other non-economic entry categories. But, refugees do not reach the same level of labor market integration as economic immigrants and natives. These results appear robust, as comparable outcomes have been observed throughout a range of national labor markets.
In most OECD countries, there is a variation in the level of country-specific introductory packages and policies toward refugees. These packages are typically designed with the goal of diminishing the employment/income gap between natives/labor migrants and refugee/family reunion migrants. The actual effectiveness of these programs remains an open question, and more empirical research is needed to inform future policy measures. Current results show that lower levels of health among refugees compared to other immigrant categories and dispersal policies used by countries to resettle refugees are among the factors that affect successful labor market integration.
Given the long-term gap in labor market integration experienced by refugees, host countries are missing out on the potential economic gains offered by refugee immigration. In turn, this gap can fuel poverty and segregation among refugees and increase societal costs. This could reduce host countries’ willingness to accept new flows of refugees into OECD countries. Although more research is profoundly needed in this area, policymakers should encourage the adoption of methods that have so far proven to be beneficial for inducing faster economic integration of immigrants; one such example is to offer early introduction assistance packages that include screening of health level and possible remedy, training in language and specific labor market aspects, and resettlement in robust labor market regions.
The author thanks two anonymous referees and the IZA World of Labor editors for many helpful suggestions on earlier drafts. Previous work of the author together with R. Pendakur contains a large number of background references for the material presented here and has been used in large parts of this article [2]. Version 2 of the article furthers the discussion on the effects of health status and dispersal policies on successful integration of refugees, includes new figures, and fully revises the references.
The IZA World of Labor project is committed to the IZA Code of Conduct. The author declares to have observed the principles outlined in the code.
© Pieter Bevelander
Has FDI into transition countries had the expected economic effects?
Foreign direct investment (FDI) has been argued to improve company performance and stimulate growth and employment. Transition economies of Central and Eastern Europe (CEE) faced a desperate need to join the global economy, to improve their competitiveness and to create jobs through FDI. So, did the FDI come, and did it deliver what was expected? FDI levels were high for CEE, and for some resource-rich transition countries (e.g. Russia and some of Central Asia), but primarily delivered significant benefits (e.g. employment) for the former. FDI arrived much later to other transition countries (e.g. the former Soviet republics and the Balkans) and had much less impact.
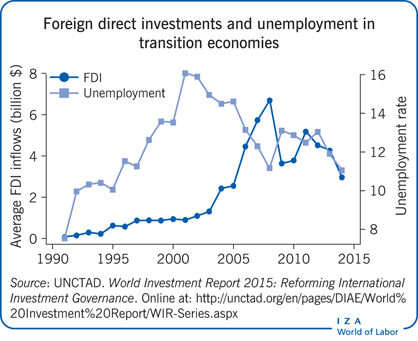
FDI was a significant investment source in transition economies, though with marked variation across regions and time periods.
FDI arrived earlier in countries that joined the EU.
Transition economies experienced positive effects on growth and the labor market due to FDI inflows.
FDI inflows were associated with higher levels of GDP and lower unemployment for some periods.
EU member states exhibit distinct effects of FDI on firm restructuring, productivity, and employment.
FDI arrived later in Russia, the Central Asian region, the former Soviet Union, and the Balkans than in EU member countries.
FDI was driven largely by resource-seeking in Russia and some of the Central Asian republics, where the effects on employment were less pronounced.
Positive spillover effects from FDI were much less apparent in Russia, the former Soviet Union, and the Balkans, likely due to institutional challenges and insufficient human capital.
FDI inflows to the transition economies have been substantial, though variable across countries. These differences are most likely explained by EU membership and domestic policies, especially concerning institutions. Considerable evidence suggests that FDI benefited recipient countries in terms of growth, employment, productivity, and trade. However, these benefits are not automatic and many factors that deter FDI also hinder its spillovers. Transition governments should thus consider policies that simultaneously enhance FDI’s scale and maximize its external benefits, particularly by improving institutional quality and human capital.
Economic transition from a planned to a market system began in 1989. There were many reasons for the demise of the Soviet bloc, but stagnation in economic growth was clearly important. Especially for economies without natural resources, foreign direct investment (FDI) was seen as a mechanism for restructuring and growth, and was facilitated by widespread privatization [1].
Under the auspices of central planning, Central and Eastern European (CEE) economies operated largely in isolation from the global economy and FDI inflows, cutting them off from many technological developments. Transition involved the restructuring of trade patterns, as well as upgrading products and implementing new technologies. However, domestic savings were scarce and there were serious deficiencies in managerial experience and capabilities, as well as relevant labor skills. Inward FDI assumes special significance in this context; providing sorely needed capital, technology, and know-how [2], [3]. Foreign firms, structured for the global economy and with their long experience of internationalization, also lead to deeper integration into the global economic system. So, how have FDI flows to transition economies actually developed since 1989, and have they produced the expected effects, particularly with respect to the labor market?
The economies of CEE have indeed received considerable inflows of FDI since 1989 [4]. However, the pattern has not been even across the whole region or time periods [5], [6], [7]. To understand the pattern, it is helpful to categorize transition economies, as defined by the European Bank for Reconstruction and Development (EBRD), into four groups according to their level of development, geography, and institutions:
FDI inflows to the entire transition region relative to unemployment are shown in the Illustration. FDI responded very slowly to the transition process before experiencing a very sharp increase from around 2003; despite setbacks following the recession in 2008, relatively high FDI continued to flow into the region as a whole. Unemployment rose steadily to 2001 and has since been falling. However, as seen in Figure 1, in 1990–2014, there were sharp differences in FDI inflows between the four regions. FDI increased earlier in the EU membership group and rose to higher levels.
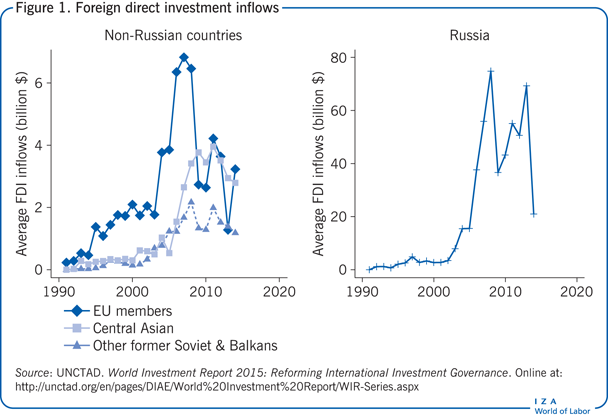
These inflows were significant for growth, representing a large proportion of total domestic investment or gross fixed capital formation (GFCF). For example, among EU members, Slovakia received more than one-third of GFCF via FDI between 2000 and 2007; Bulgaria received more than 50% of GFCF via FDI between 2003 and 2008, with a maximum of 99%! In contrast, FDI to Russia has been modest, given the scale of the host. Even so, FDI represented more than 10% GFCF after 2003, reaching more than 20% in peak years.
The other two regions, FSU and Central Asia, showed a similar pattern to Russia, but at lower rates of FDI, though even these inflows were often large as a share of GFCF, exceeding 50% in many years in Kazakhstan, Uzbekistan, and Azerbaijan.
Increased FDI inflows provide the host economies with supplies of investment that do not have to be matched by domestic savings. As such, one might expect that it would increase GDP and have positive effects on employment, reducing the rate of unemployment.
Figure 2 describes the relationship between FDI and output, plotting FDI inflows against GDP overall for each of the four regional groupings. In aggregate, FDI and GDP for the transition region are quite closely correlated, at least until 2008. This close correlation weakens after 2008, when both FDI and GDP decline, though with the former doing so more sharply than the latter. This evidence is consistent with the view that FDI was a significant driver of economic growth across the region [8].
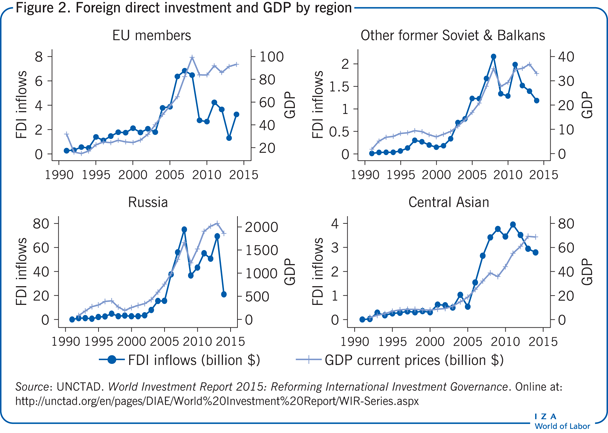
Interestingly, while the specific FDI patterns vary across the four regions, one can draw largely the same conclusion about the relationship between FDI and GDP (i.e. that FDI was a driver of GDP) in three of the four. The outlier is Central Asia; GDP growth after 2005 is not closely related to FDI inflows.
Regression analysis on the entire range of countries and sample period allows for a deeper understanding of the situation, including consideration of the direction of causality. Theory would suggest that investment, of which FDI is a major element, should lead to economic growth. This implies a time sequence in which FDI occurs first and GDP grows at a later date. Estimations confirm that previous FDI inflows do significantly increase GDP. The same holds when considering GDP per capita, which is also found to be driven by previous levels of FDI. Thus, evidence indicates that FDI has had a positive influence on levels of output and development in transition economies [9].
If FDI to the transition economies increases output, one might also expect to see it lead to a reduction in unemployment. However, the theoretical predictions are less clear-cut in this case because FDI is usually associated with enterprise restructuring, which, because firms under socialism were state-owned and had substantial overemployment, is likely to involve substantial reductions in employment [9], [10]. This is especially true if the bulk of FDI came into the transition countries via acquisitions of inefficient former state-owned firms through privatization.
As noted in the Illustration, unemployment rose in the 1990s, presumably due to the impact of enterprise restructuring on labor markets. Figure 3 reports FDI inflows against (average) unemployment for each of the four regional groupings where the picture is rather more uneven. The pattern of inverse correlations between FDI and unemployment seen among the region as a whole broadly holds for the group of EU members; the decline in unemployment starts at the end of a long gradual period of rising FDI, perhaps when the most important employment effects from restructuring are complete. Unemployment is at its lowest levels when FDI reaches its peak, and the rise in unemployment after 2008 closely follows the pattern of decline in FDI. A similar pattern of inverse correlation is seen in Central Asia, where a period of low FDI and high unemployment is followed by one of higher FDI and much reduced unemployment levels.
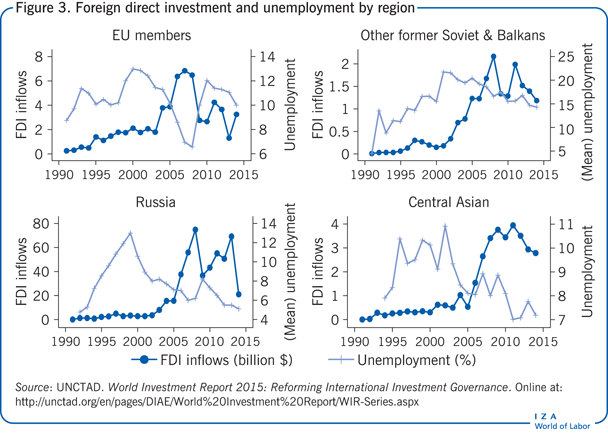
However, the trend seen in the other former Soviet and Balkan countries, suggests that the process of restructuring takes much longer and is less reliant on FDI than for the EU members [10]. It is difficult to discern any relationship between FDI and unemployment rates in Russia, perhaps because FDI is driven more by the resource cycle. Regression analysis on these data reveals that FDI in one year significantly reduces subsequent levels of unemployment. Thus, it can be concluded that FDI does act to reduce unemployment in the transition economies.
It is often argued that FDI inflows and institutional change will be closely related, though the causality is not necessarily straightforward. The evidence suggests that foreign investors will enter economies with stronger institutional arrangements because their investments will likely be better protected from expropriation or corrupt practices and their ability to earn profits will be enhanced [5]. However, the logic may also run the other way; foreign engagement in the economy may lead to domestic political and economic pressures to improve institutional arrangements. Stronger institutions will also likely be associated with better functioning labor markets [9].
The EBRD has developed a series of indicators of institutional quality for transition economies and data have been collected for the entire transition period. Figure 4 displays the average score for each of the four regional categories from 1991–2014 against FDI inflows.
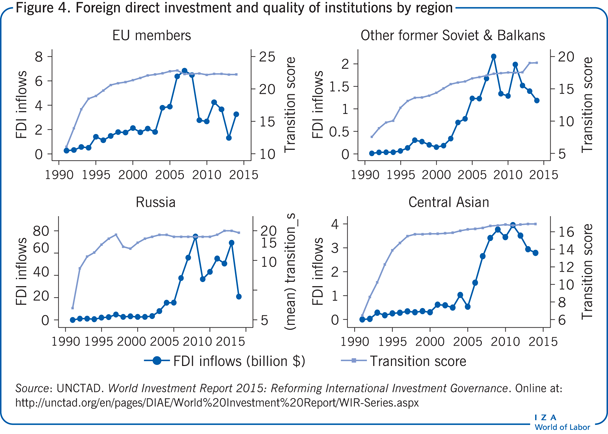
In aggregate, improvements in transition scores predate the upswing in FDI; institutional improvements in the 1990s laid the foundation for FDI from around 2000. The relationships shown in Figure 3 offer some evidence for this. FDI into EU countries rises sharply some seven years after the transition index stabilized at quite a high level, and FDI into Central Asia and Russia rises steeply some ten years after the increase in transition scores. However, in the FSU, FDI begins to rise quite early, already in 2001, while transition scores remain rather low. It is notable that institutional quality and policy environments are not always tightly related, especially in resource-rich economies like Russia and Central Asian countries.
Regression analysis confirms the above interpretation, showing that FDI responds positively, but with a lag to the transition scores. This suggests that policies to improve the institutional environment covered in the EBRD transition indicators, namely governance—liberalization, privatization, trade and exchange rates regime, and competition policies—had positive effects on FDI, and through that on growth and employment.
One major survey summarizes the empirical literature on the indirect effects of FDI on the labor market [10]. It finds that privatization to outside owners resulted in 50% more restructuring than privatization to insiders (current managers or workers). Foreign ownership was found to produce significantly more restructuring than privatization to domestic owners, especially for EU members. In the FSU, privatization to foreign owners typically yielded a positive effect, while privatization to domestic owners typically generated a negative one. Turning to employment, the authors identified 17 studies that examined the effect of ownership on employment; they found a marked tendency for privatized firms with foreign owners to increase employment relative to firms with state ownership. As such, FDI via privatizations can be seen as a leading factor generating enterprise restructuring in transition countries, especially amongst the EU members. While FDI via privatization to foreign owners may also have contributed to unemployment in the transition economies initially (as seen in Figure 3), it also enhanced competitiveness in the longer term, probably driving the later rises in output and declines in unemployment.
During the socialist era, the transition economies had become isolated, falling behind the Western world when it came to key technologies, skills, and capabilities. FDI served as an important mechanism for catching up. In particular, recipient economies could be stimulated through spillover effects from FDI, which diffuse more productive methods throughout an economy via access to advanced technology, systems, skills, training, and management, all of which can act to raise firms’ total factor productivity [2], [3]. Furthermore, rising productivity levels may contribute to improved international competitiveness, allowing the host economy to increase exports and improve their balance of payments, potentially alleviating international finance constraints to economic growth and increasing demand for labor [9].
It is usually argued that positive spillover effects from FDI derive from the diffusion of technology and knowledge between foreign entrants and domestic incumbents [2]. Demonstration effects represent an important channel for knowledge diffusion; they occur, for example, when local firms upgrade their technologies or adopt similar organizational practices to mirror more productive foreign companies [3], [8]. Furthermore, domestic entrepreneurs may also recognize the market potential of innovations introduced by foreign firms.
Labor mobility is another important mechanism that enables the diffusion of superior technology, skills, and know-how from foreign to local firms [3]. A local workforce that was previously trained and employed by foreign-owned firms might possess better skills when they accept jobs in local enterprises, or they may choose to exploit these skills through entrepreneurship. Finally, foreign investors can help domestic firms compete better in the global economy. Thus, exposure to FDI can positively influence the export decisions of existing domestic firms or help local entrepreneurs to identify export market opportunities.
However, while there is positive evidence about spillovers for particular countries, notably some EU member states such as the Czech Republic, the overall findings from FDI in transition economies are ambiguous. Of five studies specifically covering the transition region, three reveal positive spillovers, while two others find negative effects [9]. This variation is probably explained by differences in two main factors: integration to the global economy, e.g. EU membership, and the quality of institutions.
The benefits that host economies can gain from spillover effects depend on their ability to absorb the knowledge and skills being generated by foreign investors. The previous studies indicate that the scale and direction of FDI’s impact on the host economy are conditional on factors such as the quality of institutions and the levels of human capital and financial market development [9]. Thus, while the expectation is for positive effects, the host economy and domestic firms may not have the “absorptive capacity” necessary to raise their productivity to the levels attained by their new foreign competitors; the technological gaps may be too large, the incentives too weak, and the availability of human capital too limited for competitive processes to raise domestic performance [3], [8], [11]. The latter problems are characterized by shortages of key skills, including managerial ones, and deficiencies in technical education and training [8]. Thus, for FDI to produce the greatest benefits for national economic performance, institutions must be strong—especially with regard to the rule of law and freedom from corruption—and the level of human capital must be high enough to facilitate the transfer of knowledge.
There are some serious data limitations concerning FDI and its impact on transition countries’ labor markets, especially for the early years. For example, data for some of the former Yugoslav states did not become available until after 2003, and the data for the immediate post-transition period are probably unreliable because collection systems were not fully operational. FDI data are also frequently revised and the information for recent years may yet change. There is also variation across countries in the quality of the data about employment.
Descriptive and regression analysis have been used in an attempt to address the issue of causality between FDI and labor market outcomes, but the methods used were very simple, and restricted by the size of the sample and the heterogeneity of countries within it. Attempts to address this included the analysis of countries by groups categorized by geography and institutional quality, but the sample sizes within each group were too small for regression analysis.
Flows of FDI into transition economies were a significant source of investment capital, though with marked variations between different regions and time periods. FDI arrived earlier in EU member countries, but later in Russia, the Central Asian region, the FSU, and the Balkans. FDI inflows appear to have been associated with higher levels of GDP and lower levels of unemployment in aggregate, and for some specific time periods in most regions. The effects were most pronounced and occurred earlier in the EU members and were least so in the former Soviet Republics and Russia. FDI was influenced by natural resource considerations in Russia and some of the Central Asian republics, and the effects on employment were less pronounced.
The indirect effects of FDI on company restructuring, productivity, and employment were very distinct in the EU member countries; indeed, some studies suggest that much of the shift toward improved competitiveness and integration into the global economy derived from FDI. However, these positive spillover effects were less apparent in Russia, the FSU, and the Balkans. This was probably because institutions were less developed, the gap between the investing firm and domestic capabilities was larger, and the absorptive capacity of the host economies was smaller, making it more difficult to take advantage of the potential opened up by FDI.
These results have a number of important policy implications. FDI can clearly play a significant role in company restructuring and raising productivity, improving labor skills and managerial capabilities, and the diffusion of new products and technologies. This might lead countries to adopt policies incentivizing FDI. However, the benefits are not automatic; rather, they depend on the policies and structure of the host economy. For example, the differences observed between the EU members and the other transition economies highlight the benefits of EU membership. It seems likely that the institutional improvements required for EU membership played a major role in improving the EU member group’s absorptive capacity, allowing them to benefit relatively more from FDI, as well as enhancing the amount of FDI they received.
Even in the absence of EU membership, host economies obtain more benefits from FDI if they are better able to absorb the new processes, systems, and methods being brought over by foreign firms. To a significant extent, this is a matter of human capital, and the central policy to consider is one of education. However, infrastructure is also important. Better transport systems, superior ports and airports and faster information technology highways facilitate the diffusion of new products and technologies. Infrastructure acts both to encourage more FDI and to ensure that the FDI that is received has a greater benefit to the economy as a whole.
Finally, institutional quality plays an enormous role in the impact of FDI on labor markets. It is well known that foreign investors are strongly deterred by corruption, weak rule of law, and the risks of expropriation [5]. At the same time, weak institutions hinder the diffusion of new ideas that drive the positive spillovers from FDI to domestic firms. Stronger and fairer institutions are therefore critical to obtaining the benefits of FDI for labor markets.
The author thanks an anonymous referee and the IZA World of Labor editors for many helpful suggestions on earlier drafts. The author also thanks Meng Tian.
The IZA World of Labor project is committed to the IZA Guiding Principles of Research Integrity. The author declares to have observed these principles.
© Saul Estrin
https://wol.iza.org/articles/foreign-direct-investment-and-employment-in-transition-economies/long
The right policies can help the self-employed to boost their earnings above the poverty level and earn more for the work they do
A key way for the world’s poor to escape poverty is to earn more for their labor. Most of the world’s poor people are self-employed, but because there are few opportunities in most developing countries for them to earn enough to escape poverty, they are working hard but working poor. Two key policy planks in the fight against poverty should be: raising the returns to self-employment and creating more opportunities to move from self-employment into higher paying wage employment.
Most workers in low- and middle-income countries are self-employed, but earnings are typically higher and social protection programs are more widespread in wage employment.
Most workers are self-employed because they have no choice.
One goal for public policy would be to raise the returns to labor of the self-employed.
Another goal would be to move the self-employed into wage employment.
Improving the earning opportunities, creating off-farm employment, training people for wage employment, and making microcredit affordable are among the most promising policy interventions.
Absolute poverty is not primarily a problem of unemployment, but a problem of low labor market earnings among the employed.
Not enough is known about how many of the self-employed previously worked in wage employment, or why they left.
Self-employment is not the same as entrepreneurship, nor is self-employment necessarily informal.
Although some regulation is necessary and appropriate, the self-employed are often hindered excessively, which unfairly limits their earning power and may deprive them of their means of earning a livelihood.
Governments should support self-employment as a means of creating livelihood opportunities for the poor and expand opportunities for better-paying wage employment. Too often, public policies hinder the self-employed. With the right policies in place, the self-employed can boost their earnings above the poverty level. Four interventions have proved effective in a range of settings: (i) focusing economic growth on improving earning opportunities for the poor, (ii) creating off-farm jobs, (iii) training for wage employment, and (vi) making microcredit affordable.
Ten per cent of the world’s people live in extreme poverty and another 15% in poverty but not extreme poverty [1]. They are overwhelmingly concentrated in developing countries. Although they work, they are poor because there are not adequate opportunities for them to earn enough to escape poverty. They are working hard but working poor [2].
Poor people typically respond to the lack of adequate employment opportunities by creating their own self-employment opportunities. Most do this out of desperation: the only alternative to working and earning very little is to be unemployed and earning nothing.
In low- and middle-income countries (developing countries), the number of people wanting employment and capable of working in wage employment far exceeds the number of jobs. Some poor people prefer self-employment to wage employment, but for most, self-employment is worse than wage employment. Yet in the absence of unemployment insurance and other social protection programs, it is better than nothing.
The first UN Sustainable Development Goal (SDG), like the first Millennium Development Goal (MDG) before it, for good reason, is to eradicate extreme poverty and hunger. Despite the progress that has been made, worldwide poverty remains enormous.
Because labor is the main asset of the poor, unemployment is often thought to be the main reason for poverty. This is wrong. In a given week, some 190 million people are unemployed and earn nothing. This is a large number, but it pales beside the 730 million people who are employed but earn so little, in cash or in kind, that they and their families cannot achieve a standard of living of even US$3.10 per person per day [3]. (The US$3.10 figure is the current international definition of poverty in purchasing power parity (PPP) dollars. A lower figure, US$1.90 (PPP) is used internationally to define extreme poverty. More than 300 million workers around the world are in extreme poverty.)
In view of these figures, what the world has is an employment problem more than an unemployment problem [4]. What differentiates people who are poor from those who are not, then, is not whether they are employed, but how much they and other household members earn from the work they do. Fully half of the extremely poor in urban areas operate a non-agricultural business, according to an 18-country study [5].
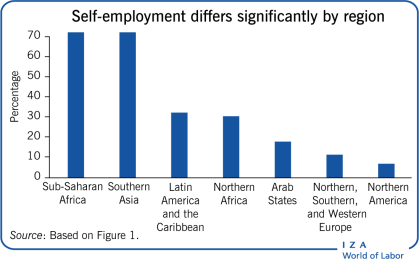
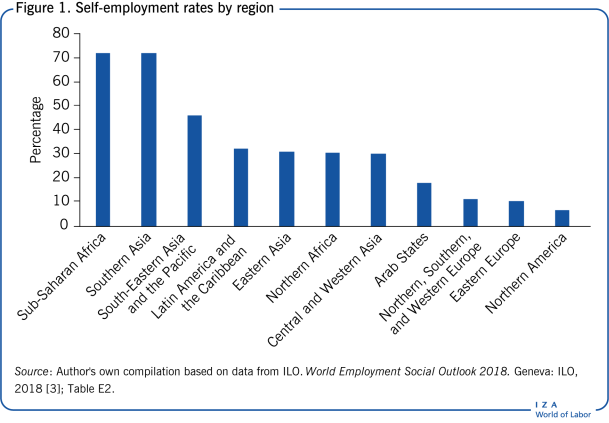
In developing economies, as noted, many poor people—often a majority—are self-employed in both urban and rural areas and inside and outside agriculture. The self-employed include own-account workers and contributing family workers. Own-account workers are self-employed individuals who do not employ others. Contributing family workers are those workers who hold self-employment jobs as own-account workers in a market-oriented establishment operated by a related person living in the same household. The ILO defines vulnerable employment in exactly the same way that self-employment is defined here (i.e. own-account workers plus contributing family workers), but that terminology is not widely used. ILO figures show that the self-employment rate for the world as a whole is equal to 42.5%. The extent of self-employment within countries varies inversely with the level of economic development, using the ILO’s country classification scheme: 76.5% of all employment in developing countries, 46.2% in emerging countries, and 10.0% in developed countries. These three groups of countries are respectively called low-income, middle-income, and high-income in other parlance. Broken down by regions of the world, sub-Saharan Africa is tied with Southern Asia for the highest rate of vulnerable employment—both have a rate of 72.1%. Figure 1 displays these rates for each of the ILO’s country groupings.
Self-employment is sometimes equated with entrepreneurship, but this can be misleading. To many people, “entrepreneurship” conjures the image of a risk-taker setting up a business with the intent of making it grow and prosper. In developing countries, however, the goal of much self-employment is far more modest: to earn money for a time—preferably, a short time—before transitioning to a more remunerative activity.
An example is saving money to buy a package of 20 cigarettes and then selling them individually at a higher unit price and surviving on the profits. Workers (mostly young men) engaged in such survival self-employment can hardly be called “entrepreneurs” in the everyday sense of the term. They engage in such activities reluctantly and only until they can find something better. The majority of self-employment enterprises lack the potential to grow, as studies in Sri Lanka, West Africa, and elsewhere demonstrate.
Self-employment is also sometimes equated with working informally. But equating the two is unhelpful. “Working informally” and the associated terms “informal economy” and “informal sector” are not defined consistently in empirical studies, so “informality” means different things to different people. And even when the conceptualization is clear, as when informal employment refers to work outside the protection and regulation of the state, it is difficult to quantify this concept in the data.
While many people who engage in unprotected and unregulated work are paid workers, not self-employed, there are only vague estimates of how many there are. Even less is known about how many self-employed people are engaged in informal activity according to the unprotected/unregulated definition and how many are not. The evidence points to most own-account enterprises and other very small firms being unregistered despite government efforts to get them to register [6].
The literature distinguishes two quite different reasons for self-employment. Some are self-employed because they have ideas for profitable businesses and seek to become successful entrepreneurs. An example is a backyard auto mechanic who learned his trade as a paid employee in an established garage, then left voluntarily to set up his own business. Others are self-employed because they do not have the possibility of being wage employees, a condition most of them appear to prefer. In this sense, they are self-employed because they have no choice. They are too poor to remain unemployed and earn nothing.
Duality within self-employment is found throughout the developing world. Controversy remains over the relative importance of the choice and no-choice routes to self-employment, and more research is needed to investigate this issue in specific countries. One careful study concludes that two-thirds of self-employment in the developing world as a whole results from individuals having no better alternatives [7]. Another finds an approximately equal split in non-OECD countries [8]. It is crucial to have data on how many of the self-employed in developing countries had previously been wage employees and could have continued in wage employment but left their jobs willingly in order to create their own enterprise. Although little is known about this, it seems to be relatively rare.
Self-employment and poverty are closely linked, albeit not perfectly. The international network Women in Informal Employment: Globalizing and Organizing (WIEGO) finds that the self-employed are concentrated in high-poverty-risk, low-average-earnings categories [9]. In the words of one study of the working poor: “Perhaps the many businesses of the poor are less a testimony to their entrepreneurial spirit than a symptom of the dramatic failure of the economies in which they live to provide them with something better” [5].
Street vendors are ubiquitous throughout the developing world. They sell handicrafts, ice cream, lottery tickets, and just about everything else. But South Africa is different [10]. In cities like Johannesburg, Cape Town, and Durban, street vending is entirely absent or confined to a very restricted area. The reason for this is local government policies: for example, Durban had issued just 872 trading permits as of 2005, far fewer than the number of people who want to be street traders. The government arrests, fines, or jails unlicensed traders and confiscates their inventory. This all-too-real threat deprives countless people of a livelihood.
Some regulations are needed to protect against abuses. Products that are illegal or dangerous need to be regulated. And some sales practices are threatening to customers, who need to be protected. But some regulations and restrictions needlessly hinder the self-employed poor and prevent them from earning even a meager living.
Policy interventions to boost the labor market earnings of the self-employed can be put into two broad groups: those that raise the returns to the self-employed in their current activities and sectors, and those that help the self-employed transition into new, better-paying wage activities.
Policies that can raise the returns to the self-employed in their current activities and sectors include:
Other policies can expand opportunities for wage employment so that the self-employed poor can move into more remunerative employment. These include general measures affecting labor markets:
Policies can also include labor market measures aimed specifically at generating more wage employment:
The highest priority interventions vary from country to country, and from place to place and group to group within a country. Countries have different objectives and different trade-offs and constraints on both the policy and the budget sides. The constraints bind differently, the most obstructive constraints differ by circumstances, and the most cost-effective way of intervening to relax the constraints also varies. The World Bank’s 2013 World Development Report entitled Jobs offers an eight-way typology for prioritizing policy interventions for different categories of countries [11].
In all countries, however, policies are needed that provide opportunities for poor, self-employed workers to earn more at their current activity or move into more remunerative activities. To be avoided are policies, evident in many countries, that make life more difficult for the self-employed and deprive them of the opportunity to earn a living.
As always, no single policy or group of policies will work everywhere. But there are some particularly promising interventions that have succeeded in multiple contexts, and some of them are highlighted in what follows.
Four interventions appear to be particularly effective and could guide future efforts to improve employment opportunities for the poor [2]:
These policy priorities are not the only potentially powerful policy interventions. Entrepreneurship policies might also be worth pursuing. But these four policy priorities hold particular promise and have demonstrated their effectiveness in a range of settings.
Across East Asia, the growth paths pursued by Japan, then the Asian tigers (Hong Kong, Taiwan, Singapore, and South Korea), then the Asian cubs (Indonesia, Malaysia, Philippines, and Thailand), and then China and Vietnam have improved conditions for workers by focusing production not only on the domestic market but also on exports to the rest of the world. The self-employed benefited from this economic growth by remaining self-employed and participating in the expanding supply chain, by being hired into wage jobs, and by taking advantage of government programs previously unavailable or unaffordable to them. The growth in labor earnings spread beyond the target manufacturing sectors in these countries to wage employees and the self-employed in agriculture and services. The benefits of the tighter labor market brought about by economic growth have been widespread.
India’s National Rural Employment Guarantee Act (MGNREGA) is the most ambitious workfare program ever attempted. In all 625 districts in India, rural households are guaranteed 100 days of employment a year. More than just an opportunity to apply for work, this program entitles all rural households to take advantage of the employment guarantee. Program participants include the self-employed, workers in household enterprises, and day laborers. Despite some “operational deficiencies” on the ground (a polite way of saying “corruption”), the program is credited with substantially raising the labor earnings of rural workers.
One way to help the self-employed is to equip them with the skills to fill existing job vacancies. The government of Mexico created the job-training program Bécate (formerly Sicat and before that Probecat) to enable employers to offer training in the skills they need. The government does not prescribe what these skills should be—employers do—so training is offered in specific areas, such as air conditioning repair and lathe operation. Among the beneficiaries are previously self-employed people who are able to move from low-paying self-employment into better-paying wage employment.
Across developing countries, the self-employed would willingly invest in many potentially profitable activities if they could secure affordable credit. But in most countries, the self-employed face extortionate interest rates: 10% a month in much of the developing world, 40% a month in the Philippines, and 4.7% a day in Chennai, India. In the Indian state of Andhra Pradesh, with a population of 80 million people, the government has moved to remedy this situation by establishing a program for banks to lend to groups of women, rather than to individual women, and charge 12% interest a year. Borrowers are offered a prompt-repayment incentive by the state government, which gives borrowers a nine percentage point subsidy if they repay their loans on time, lowering their effective interest rate to 3% a year.
The largest gap in understanding self-employment in developing countries is knowing why so many people are self-employed. How many self-employed people came to self-employment after wage employment? Could their wage employment have continued, or were they in casual employment that ended? Are people choosing self-employment because of such non-wage benefits as being one’s own boss and enjoying greater flexibility between work and family responsibilities? What are the roles of family, personal preference, and health status? How do workers’ net earnings in self-employment compare with what they might have earned in wage employment? How do the answers to these questions differ by gender?
Another major gap is the lack of social (rather than personal) cost−benefit analysis of possible policy interventions. How do the direct social benefits of any given intervention compare with the direct social costs? Because there are always policy trade-offs (given scarce resources, money used for one purpose comes at the expense of another), it is important to know which policy intervention produces the highest social benefits relative to its costs. In which circumstances have various policy interventions proved socially beneficial and in which have they not?
Finally, more research is needed to establish how many people are self-employed by choice and how many because they have no choice. The numbers in the second category are clearly large, but greater precision is needed, especially on a country by country basis, to end the controversy over exact numbers.
Self-employment is the predominant mode of economic activity among the world’s poor, but because there are few opportunities in most developing countries for the self-employed to earn enough to escape poverty, they are working hard but working poor. Self-employment should be recognized as an important means of providing the poor with a decent livelihood and deserving of support so that the self-employed can escape from poverty.
Two key policy planks in the fight against global poverty should be raising the returns to self-employment and creating more opportunities for poor people to transition from self-employment into higher paying wage employment. Four interventions appear to be particularly effective and could guide efforts to improve employment opportunities for the poor:
These four measures have demonstrated their effectiveness in a range of settings. Entrepreneurship policies might also be worth pursuing. And, above all, governments should avoid over-regulation that hinders rather than supports the self-employed.
The author thanks an anonymous referee and the IZA World of Labor editors for many helpful suggestions on earlier drafts. This article is based on Fields, G. S. Self-Employment in the Developing World. Background Research Paper, submitted to the UN High Level Panel on the Post-2015 Development Agenda, May 2013; and [4]. Version 2 of the article updates the figures, explores why people are self-employed, and updates the references, adding new “Key references” [4], [7], [8].
The IZA World of Labor project is committed to the IZA Code of Conduct. The author declares to have observed the principles outlined in the code.
© Gary S. Fields
https://wol.iza.org/articles/self-employment-and-poverty-in-developing-countries/long
Gender gaps in wages and leadership positions are large—Why, and what can be done about it?
Gender wage gaps and women’s underrepresentation in leadership positions exist at remarkably similar magnitudes across countries at all levels of income per capita. Women’s educational attainment and labor market participation have improved, but this has been insufficient to close the gaps. A combination of economic forces, cultural and social norms, discrimination, and unequal legal rights appear to be contributing to gender inequality. A range of policy options (such as quotas) have been implemented in some countries; some have been successful, whereas for others the effects are still unclear.
Women’s educational attainment and labor market participation have improved in middle-income and, to a lesser extent, in low-income countries.
Women’s presence in professional, technical, and managerial roles and leadership positions in politics has increased in recent decades.
Increased female representation in government and corporate leadership can benefit women at lower ranks and help change perceptions about the role of women in society.
In recent years, several women have become CEOs of important companies, providing role models for other women.
Male–female wage differentials are large and persistent and do not automatically shrink with economic development.
Despite some gains, women remain severely underrepresented in top leadership positions in institutions and firms.
Gender gaps in wages and representation in managerial positions likely reflect an inefficient allocation of talent, with negative consequences for growth.
In many low- and middle-income countries, legal provisions exist that restrict women’s freedoms and opportunities.
Policy interventions aimed at increasing women’s human capital are essential; however, they cannot be expected to automatically close the gender gaps in labor force participation, wages, and political and corporate leadership that exist in countries at different levels of income per capita. In some contexts, affirmative action and gender quotas have had positive effects and also created role models. Eliminating legal discrimination against women, and promoting policies to counteract discrimination and cultural and social norms that, in many countries, have traditionally assigned women subordinate roles should be critical policy goals.
Gender disparities exist in virtually all countries around the world, with women being disadvantaged in many areas such as health, education, and labor market opportunities. Male–female gaps are especially large in developing countries [1]. This phenomenon raises issues of social justice and human rights, and might also lead to substantial economic costs to society if it results in an inefficient allocation of talent and distorts the incentives to invest in human capital. It is therefore worthwhile to identify and quantify the specific gender gaps that exist with respect to wages and leadership positions within institutions and organizations. Comparing these gaps as they exist in countries at all levels of income can provide insights into their causes and consequences, and can help understand the link between the two phenomena. It is also useful to examine how policy has so far been used to address these gaps, and how lessons from these experiences can be applied towards future policy recommendations.
In the past decades, several indicators of women’s involvement in the economy have improved around the world. These advances have occurred both in absolute terms and relative to men. The accumulation of human capital through formal education, for example, represents an essential prerequisite for productive participation of individuals in the labor market. Figure 1 shows that the ratio of women to men enrolled in primary and secondary education increased from 0.70 in the period 1990–1995 to 0.89 in 2010–2014 in low-income countries, and from 0.89 to 0.97 in lower-middle-income countries. Similarly, increases are observed in the share of women enrolled in tertiary education (universities and other post-secondary institutions). The ratio of women to men enrolled at tertiary level in public and private schools went from 0.97 in 2000 to 1.13 in 2012 in lower-middle-income countries and from 1.24 to 1.32 in upper-middle-income countries (this indicates that more women than men are now enrolled in tertiary education in middle- and high-income countries). In low-income countries, the ratio has increased from 0.5 to 0.6, suggesting a modest improvement, though clearly still lagging behind wealthier countries.
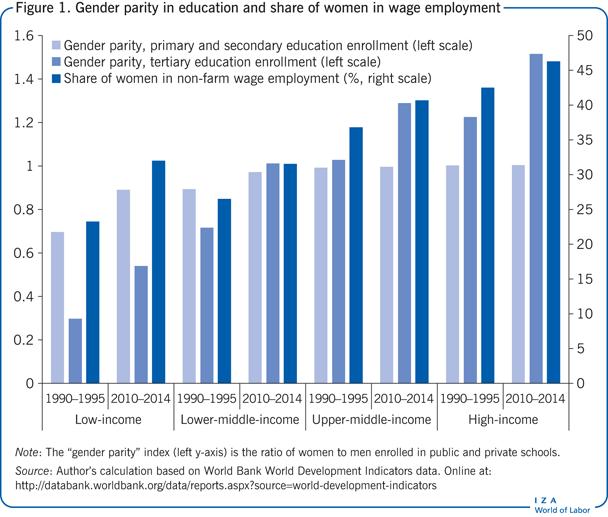
Figure 1 also reports the share of women in non-farm wage employment, an indicator of the contribution of women in the sectors of the economy typically characterized by higher productivity. On this front, progress has been made in countries at all levels of economic development. In the period 2010–2014, women represented 46% of total non-farm wage employment in high-income countries, up from 42% in 1990–1995. In low-income countries, the increase over the same period has been substantial, with women’s share of non-farm employment growing from 23% to 32%; a similar increase, from 26.5% to 31.5% is observed in lower-middle-income countries. However, the levels of female participation in paid non-farm employment are still substantially lower in middle- and low-income countries compared to high-income countries.
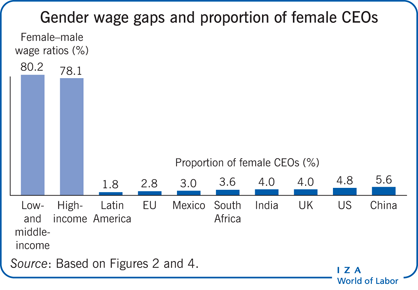
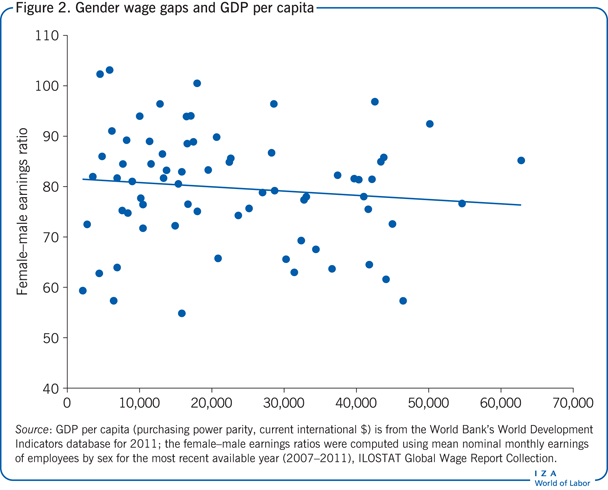
What about gender wage differentials? Given that women in high-income countries enjoy similar (and sometimes higher) levels of education than men, while women in lower-income countries are still at an educational disadvantage, one would expect male–female wage gaps to be systematically smaller in higher-income countries. Figure 2 plots female–male earnings ratios against GDP per capita. Three main messages emerge from this figure. First, women’s earnings are lower than men’s in virtually all countries; on average, the female–male earnings ratio is 79.8, indicating that women earn 20% less than men. Second, there is wide variation in the female–male earnings ratio around the world, ranging from below 60 to slightly above 100. The third and perhaps most striking feature of the data is that there appears to be essentially no relationship between the level of GDP per capita and the gender wage gap; in particular, earnings disparities between women and men are not narrower in richer countries. More specifically, women’s earnings are 80% of men’s in countries with GDP per capita below $10,000, 82% in countries with GDP per capita between $10,000 and $30,000, and 76% in countries with GDP per capita above $30,000. Thus, although women in many countries have reached parity with men in terms of formal educational attainment and participation in wage employment (Figure 1), there appears to be no correlation between the gender wage gap and per capita GDP (Figure 2).
As shown in Figure 1, women’s participation in non-farm wage employment has increased substantially in the past decades in low-, middle-, and high-income countries; women are also bridging the education gap, as indicated by increased tertiary education enrollment rates. Yet, in spite of increased human capital and labor market participation, women remain underrepresented in leadership positions in institutions and organizations. As Figure 3 illustrates, women only hold around 20% of parliamentary seats worldwide; the percentage is only slightly higher in high-income countries (23.8%) than in low-income countries (20.3%). This important measure of women’s participation in political life has shown substantial increases over time. In particular, in low-income countries, women’s share of parliamentary seats went from about 10% in 1990 to 20% in 2015. Despite these improvements, women’s share of parliamentary seats remains below their share in the labor force, not to mention the population at large. The underrepresentation of women in positions of leadership is even more dramatic at the very top of political institutions. As of October 2015, a woman was president or prime minister in only 16 of the countries included in the World Bank’s World Development Indicators database. As reported in Figure 3, the proportion of female prime ministers or heads of state was 12.5% in high-income countries, around 5% in middle-income countries, and about 3% in low-income countries in 2015.
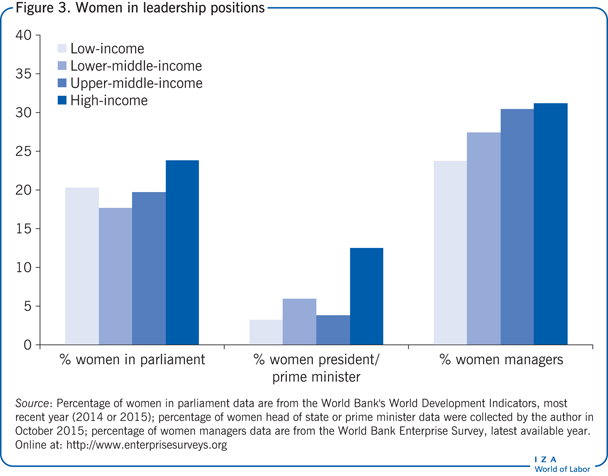
A similar picture emerges when looking at women’s representation in firms. According to data from the World Bank Enterprise Surveys, based on surveys of more than 100,000 private firms in 126 countries, about 29% of top managers were women on average in the most recent available year. Figure 3 reveals that the proportion of female top managers is highest in high-income countries and lowest in low-income countries, but the difference is only seven percentage points (31% vs 24%).
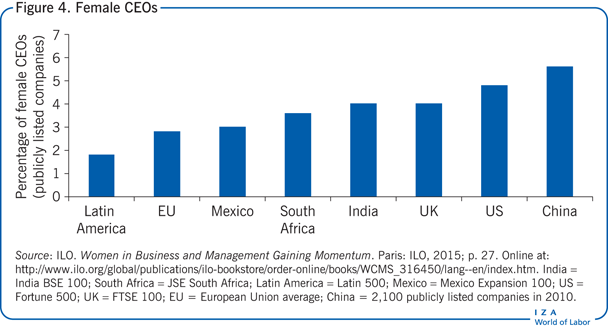
Looking at the very top of organizations, a similar picture emerges. A recent publication by the International Labour Organization (ILO) reports data on the proportion of female CEOs in publicly listed companies in several countries. The proportions are remarkably small, with women being severely underrepresented among the largest publicly traded firms in all countries. Data for a group of selected countries and regions are presented in Figure 4. Women represent 4.8% of CEOs in the US Fortune 500 companies, 5.6% in China’s publicly listed companies, 1.8% in Latin 500 companies, 2.8% in publicly traded companies in the EU, 3% among the Mexico Expansion 300 companies, and 4% of CEOs among India’s Mumbai Stock Exchange 100 companies. The ILO publication includes more detailed analyses of a group of countries, reporting that in spite of significant improvements in women’s presence in professional, technical, and managerial roles, only a small fraction of CEO and other top executive positions are held by women. Thus, when looking at both political institutions and firms, one finds that “glass ceilings” do seem to be in place, which prevent women from advancing to the highest ranks.
Women’s disadvantage in developing countries is not limited to the labor market. Gender disparities exist in health and education, in basic freedoms and autonomy, and in the distribution of bargaining power within the household [1]. Some of these gender gaps do decline with economic development; for example, as in the above case regarding educational attainment and paid labor force participation. However, the fact that earnings gaps and the underrepresentation of women in top leadership positions are remarkably similar across countries at very different levels of GDP per capita indicates that economic development does not automatically close all gender gaps, and that other causes and mechanisms must also be at play.
A large literature in labor economics is devoted to “explaining” the gender wage gap. Most of the literature focuses on high-income countries (notably the US). This is primarily due to the greater availability of high-quality data in higher-income countries. Moreover, the nature of work, particularly women’s work, in poor countries is often very different than in richer countries, which means that “standard” comparisons of wages and career progression may not be applicable in those contexts. Different patterns of selection by gender into the paid labor force complicate the picture even further.
A comprehensive gender wage gap decomposition exercise was performed with data from 64 countries around the world, including several middle- and low-income countries [2]. This exercise was meant to determine how much of the gender gap in hourly earnings is accounted for by individual characteristics and job characteristics and it can shed light on the causes of gender gaps, and thus potentially inform policy. For example, if differential educational attainment explains much of the gap, then interventions aimed at increasing pre-labor market human capital accumulation by women should be pursued more aggressively; if, on the other hand, industry or occupation are responsible for a large portion of the gap, then attention should also be devoted to better understanding the causes of occupational segregation by gender. It is important to examine these issues on a country-by-country basis, because gender gaps could well have different causes in different places, and there could also be important differences between groups within a country. There are several results of interest in this study. In Africa, the Middle East, and South Asia, a large fraction of the gender gap is explained by demographic characteristics. On the other hand, in Western Europe, Eastern and Central Asia, East Asian and Pacific countries, and in Latin America and the Caribbean, female workers, on average, possess characteristics (e.g. education) that, in principle, should make them earn higher wages than men in the labor market. In particular, in Eastern and Central Asia, the Middle East, North Africa, and East Asian and Pacific countries, higher educational achievements by women do not appear to be rewarded in the labor market. Job-related characteristics such as occupation and industry are also found to play a role, although a substantial portion of the gender gap remains “unexplained.”
Although more research is needed, the findings reported above indicate that improvements in educational attainment may not automatically translate into reduced gender earnings gaps; similarly, reducing occupational segregation is helpful, but also is not likely to entirely close gender disparities in earnings, suggesting that other factors, possibly including discrimination, gender roles and the division of labor within the household, as well as psychological traits and non-cognitive skills may be at play.
Although female underrepresentation in leadership positions is a widespread phenomenon, the causes of this phenomenon might be different in different contexts. Studying these causes with respect to an organization’s top level is difficult due to the complex process of selection and allocation of executives to firms. Some recent studies have taken advantage of variation prompted by sudden policy changes (e.g. the introduction of gender quotas) to estimate the effects of female leadership on a range of outcomes, whereas other studies report the results of randomized field experiments. One study based on data from 16,000 firms in 73 developing countries finds that countries with higher female–male ratios in primary, secondary, and tertiary education enrollment rates also have higher proportions of female top managers [3]. Though female underrepresentation remains substantial, these findings suggest that improving women’s educational access and attainment in developing countries can at least help create the conditions for women to achieve leadership roles in firms.
Another recent study analyzed a large data set of publicly traded companies in Latin America and the Caribbean [4]. This study finds that companies with more female members on the board of directors are significantly more likely to have one female among the firm’s executives, and that when women make up at least 30% of executives, there is a positive association with firm performance. The latter result is consistent with findings from a study using matched employer–employee data from Italy, which found that the impact of female leadership on firm performance (sales, value added, and total factor productivity) increases with the share of female workers in the firm [5]. Moreover, the Italian study finds that female CEOs are associated with higher wages for women at the top of the female wage distribution but not at the bottom, which the authors interpret as being consistent with statistical discrimination. Research using data from more than 30,000 firms in 74 developing countries documents that when a firm’s dominant shareholder is a woman, there is a considerably higher probability that the company’s CEO is also a woman [6], and a study using rich matched employer–employee data from Norway finds that greater female representation at higher ranks of the corporate hierarchy narrows the gender gap in promotion rates at lower ranks [7]. These results suggest that, at least in part, the effect of female leaders works through their interaction with the female workforce, and that the underrepresentation of women at the top of companies’ hierarchies might be generating substantial efficiency costs due to the misallocation of female talent. The results also indicate that “women help women” (particularly talented women), and that policies that increase female representation in corporate leadership might also have positive effects for women at lower ranks.
Recently, in addition to human capital and discrimination, a range of psychological factors have been proposed as explanations for gender gaps in the labor market. For example, evidence suggests that women may be more risk-averse, and less willing to negotiate and compete than men, which could explain both women’s lower wages and their underrepresentation in top positions in organizations. Social and cultural factors also appear to play a role. In a study of the effect of attitudes toward gender roles on labor market outcomes in a sample of OECD countries, a strong negative correlation is found between anti-egalitarian views (e.g. the perception that women’s role in society is that of homemakers and the role of men is to be breadwinners) and female employment rates and gender earnings gaps [8]. There is also evidence that the evolution of attitudes concerning gender roles is correlated with the evolution of the gender gap in labor force participation. This indicates that changes in social norms and perceptions can have real effects on behaviors and outcomes, although the effects are more likely to manifest themselves over medium–long periods of time. Psychological and cultural factors can potentially interact with each other. For example, women might avoid competitive settings or be reluctant to negotiate to comply with prevailing social norms or stereotypes that assign them a certain role.
In many countries, women are not afforded the same opportunities as men. This is especially the case in developing countries. A recent World Bank report describes several government policies that limit women’s participation in the labor market, particularly their ability to engage in entrepreneurial activities [9]. In 155 of the 173 economies covered, there is at least one legal barrier for women that does not exist for men. For example, in 18 countries, husbands are legally allowed to prevent their wives from working, and in some countries women are legally required to obtain their husband’s permission before they can register a business. Not surprisingly, the report finds that lower legal gender equality is associated with worse outcomes for women, including lower enrollment in secondary school, lower labor force participation, larger earnings differentials, and reduced propensity to start or run a business. Reforms granting women equal rights have been implemented in many countries, particularly in developing countries. However, enforcement is often weak [1], [9]. The lack of access to certain positions, occupations or industries creates informational barriers for women that can contribute to the perpetuation of disparities, even in the absence of legal restrictions. This concept is supported by evidence from Uganda, which indicates that lack of information about opportunities in male-dominated sectors explains gender differences in sector choice [10].
In recent years, several countries have introduced quotas to increase women’s representation in legislative bodies and corporate boards. In addition to ensuring a gender composition that better reflects electoral bodies or companies’ workers, these policies’ goals include influencing the kinds of policies enacted by government bodies or companies, and changing attitudes toward gender roles in society. Most of these reforms are too new to be properly assessed, though some rigorous evaluations have been performed.
In India, one-third of village council head positions are reserved for women. The effects of this policy were evaluated by exploiting the policy’s random assignment of village councils where only women could be elected as council head [11]; the findings indicate that female leaders implemented policies that were more relevant to the needs of other women in their jurisdiction. Another study finds that the same policy had a “role model” effect, which changed young girls’ career aspirations (and their parents’), eliminated gender gaps in educational attainment, and reduced girls’ time spent on household chores [12]. Further evidence on the effects of similar policies comes from studies focusing on a group of European countries, which have introduced gender quotas in corporate boards. One example is Norway, which in 2006 mandated that 40% of seats on publicly traded companies with certain characteristics be reserved for women. This reform reduced the gender gap in earnings among board members but did not have a significant impact on overall gender wage gaps or female representation in top managerial positions in the firms affected [13]; also, no effects were found on young females’ enrollment in business education programs, or on their fertility and marital plans. However, the observed effects are short-term, and it is still too soon to estimate longer-term effects that the reform might eventually have.
The empirical literature on the causes and effects of women’s underrepresentation in leadership positions in developing countries is scarce, as is the body of empirical work on gender wage gaps in developing countries. In particular, there is a paucity of work based on longitudinal data and matched employer–employee data. These data sets, now widely used in studies that focus on high-income countries, are better suited than cross-sectional data to derive causal relationships. Matched employer–employee data can be particularly useful to study discrimination in the workplace. Government-mandated gender quotas are useful from a scholarly point of view because they create quasi-exogenous variation, which helps with the identification of causal effects; however, many reforms were passed only recently, and therefore it is too soon to estimate their full potential effects.
Substantial gender wage differentials exist in countries at very different levels of economic development, and women are greatly underrepresented in leadership positions in political institutions and firms. However, in many countries, women and men now participate equally in the labor force; and in the case of education, in many countries the gender gap has actually been reversed, with female enrollment often surpassing male enrollment. Despite these gains, the magnitude and persistence of wage and leadership gender gaps continues to pose some challenges to scholars and policymakers.
Research on the wage gap suggests that factors such as education, occupation, and industry explain only part of the differences, and that other factors are at play, including gender differences in psychological traits (e.g. risk aversion and attitudes toward negotiation and competition), socio-cultural norms and dynamics (e.g. norms that traditionally assign women and men different roles in the household and in society), and discrimination. There is no consensus about the relative importance of these factors, and in some areas the literature is still young and scarce.
Research on the causes and consequences of gender gaps in leadership positions in organizations has grown in recent years, although, similarly to research on wage gaps, most of it is based on data from high-income countries. Some of this research emphasizes the role of interactions between female leaders and other women in the firm through various channels, including communication, mentoring, and offering role models. In addition to raising issues of social justice, there are indications that these gender disparities are economically inefficient because they imply a sub-optimal allocation of female talent.
Some countries have introduced gender quotas in leadership positions in political institutions and firms. In India, evidence indicates that female leaders implemented policies that benefited other women, and also created role models that influenced young women’s education and career aspirations and decisions. Evidence from gender quotas in companies’ boards of directors is more mixed, however these policies were implemented in recent years, and some of the effects will probably take time to become visible.
Policy interventions aimed at reducing gender disparities in education and labor market participation are important. In low-income countries, women display enrollment rates considerably lower than males in primary, secondary, and tertiary education. Moreover, in many developing countries, women are held back by significant legal restrictions that limit their rights within the household, curbing their ability to participate in the labor market and society. Recent trends show improvement of women’s legal rights in many countries, but further policy action is needed.
The author thanks an anonymous referee and the IZA World of Labor editors for helpful suggestions on earlier drafts. The author would also like to thank David Evans, Fernanda Ruiz Nuñez, and Fabiano Schivardi for comments, and Luca Flabbi, Andrea Moro, and Fabiano Schivardi for many conversations and our joint research on some of the topics of this article.
The IZA World of Labor project is committed to the IZA Guiding Principles of Research Integrity. The author declares to have observed these principles.
© Mario Macis
https://wol.iza.org/articles/gender-differences-in-wages-and-leadership/long

DESCRIPCIÓN DEL GRÁFICO
¿Gracias a papá o por méritos propios? La forma en la que los milmillonarios del mundo han amasado su riqueza da buena muestra del modo en el que funciona un país. En Chile, por ejemplo, el 67% lo ha hecho gracias a la herencia, mientras que en Rusia las conexiones políticas son la causa del 67% de los casos y en Japón la fundación de empresas ha encumbrado al 63%.https://e887d85e0b5b9d491c3009d00f53fbcc.safeframe.googlesyndication.com/safeframe/1-0-38/html/container.html
Los datos provienen de un estudio publicado en 2016 por el Peterson Institute for International Economics (PIIE), “una organización de investigación independiente sin ánimo de lucro y apartidista dedicada a fortalecer la prosperidad y el bienestar humano en la economía global” de Estados Unidos. A partir del análisis de los datos recopilados por Forbes a lo largo de veinte años (1996-2015), los investigadores del PIIE elaboraron una lista que incluía información sobre la compañía asociada a cada milmillonario y a la forma en la que había accedido al club de los superricos. En el primer año analizado, en la lista apenas aparecían 40 países; en 2015, 70.
¿Quieres recibir contenidos como este en tu correo?Apúntate a nuestro boletín semanal
Las conclusiones fueron principalmente tres: una, que en los mercados emergentes el número de multimillonarios está creciendo a un ritmo mayor que el resto del mundo; dos, que la riqueza proviene cada vez más de méritos propios y no de herencias; y tres, que existen importantes diferencias regionales. El sudeste asiático es hoy en día el centro del emprendimiento mundial, mientras que Oriente Próximo y el norte de África son las únicas regiones donde la riqueza heredada está creciendo y cada vez menos fundadores de empresas llegan a sumar mil millones de dólares.
El estudio también detectó que en Estados Unidos la élite de milmillonarios es mucho más dinámica que en Europa. No en vano, alrededor de un tercio de los estadounidenses heredaron su riqueza, mientras que en el caso de los europeos la proporción asciende hasta casi la mitad. La edad media de un fundador de una empresa superrico en Europa es también veinte años más elevada que en Estados Unidos. La pujanza de las compañías tecnológicas y financieras en este último explican la brecha.
https://elordenmundial.com/mapas/riqueza-grandes-ciudades-europa/embed/#?secret=AJq3mCf359
A nivel global, antes de la pandemia, la riqueza extrema batía récords cada año. La Lista Forbes 2015 incluyó a un total de 1.826 milmillonarios, con un número cada vez más grande de adultos por debajo de los 40 años y mujeres. Pero ¿qué impacto tuvo el coronavirus? A pesar de la paralización de gran parte de la economía mundial durante varios meses y la consecuente crisis económica, lo cierto es que la riqueza de los hogares y de los más ricos no se vio muy afectada. Más bien al revés: según el último informe de Credit Suisse, la riqueza global aumentó un 7,4% en 2020, mientras que la riqueza por adulto creció otro 6%.
Además, el informe también identificó 56,1 millones de millonarios en todo el mundo, 5,2 millones más que un año atrás. El 39,1% están radicados en Estados Unidos, el 9,4% en China y el 6,6% en Japón. No obstante, en algunos países donde la pandemia sigue descontrolada y la llegada de vacunas se está haciendo esperar el número de millonarios decreció, como es el caso de Brasil, India, Rusia o México.
Despite being illegal, costly, and an affront to dignity, sexual harassment is pervasive and challenging to eliminate
Workplace sexual harassment is internationally condemned as sex discrimination and a violation of human rights, and more than 75 countries have enacted legislation prohibiting it. Sexual harassment in the workplace increases absenteeism and turnover and lowers workplace productivity and job satisfaction. Yet it remains pervasive and underreported, and neither legislation nor market incentives have been able to eliminate it. Strong workplace policies prohibiting sexual harassment, workplace training, and a complaints process that protects workers from retaliation seem to offer the most promise in reducing sexual harassment.
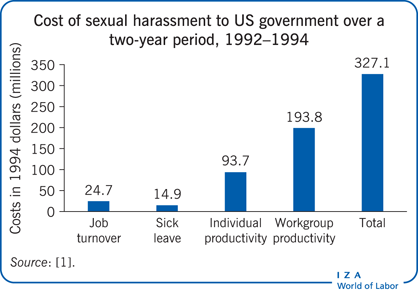
Largely overlooked until the 1970s, sexual harassment in the workplace is now internationally condemned as a form of sex discrimination and a violation of human rights.
More than 75 countries have legislation prohibiting workplace sexual harassment.
Legislation varies by country and includes protection against workplace sexual harassment under both civil and criminal law.
Like workers at risk of injury or death, those at risk of sexual harassment receive a pay premium.
Organizations have prohibited sexual harassment and have established complaint procedures.
Sexual harassment is difficult to define, measure, and monitor.
Sexual harassment is underreported, which reduces the efficacy of legislation and workplace policies prohibiting it, as these policies depend on reporting to discourage harassment.
Workers who report sexual harassment are likely to be subject to retaliation.
Women face a higher risk of sexual harassment than men.
Sexual harassment is costly to its victims and to the organizations in which it occurs.
Sexual harassment, a violation of human rights and a form of sex discrimination, is costly to workers and organizations. Yet although more than 75 countries have legislation prohibiting sexual harassment in the workplace, it remains pervasive and underreported. To date, laws and market incentives have been insufficient to eradicate workplace sexual harassment. Success may require policies to enhance market and legal incentives by raising the costs to organizations of tolerating an adverse work environment, promulgating strong policies against sexual harassment, and establishing a complaints process that protects workers from retaliation.
Before the 1970s, the term “sexual harassment” would have been met with a blank look. Sexual overtures and disparaging remarks about workers’ competence based on their gender were widely considered acceptable behavior. In 1974, a US district court judge found that a woman whose job was eliminated in retaliation for refusing to have sex with her supervisor was not protected under employment law but was instead facing the personal consequences that may arise when sexual advances are rebuffed.
Recognition of sexual harassment as an illegal workplace behavior originated in the US following influential work by Catharine MacKinnon, who argued that sexual harassment is sex discrimination under Title VII of the Civil Rights Act of 1964. In 1980, the US Equal Employment Opportunity Commission (EEOC) issued guidelines defining workplace sexual harassment. Many countries quickly followed the US’s lead in recognizing sexual harassment as an illegal form of workplace behavior. Sexual harassment in the workplace is now internationally condemned as a form of sex discrimination and as a violation of human rights. It is costly to workers and organizations. Yet it remains pervasive. What market failures prevent its eradication, how effective is legislation, and what policies can reduce the incidence?
Sexual harassment includes a wide range of behaviors, from glances and rude jokes, to demeaning comments based on gender stereotypes, to sexual assault and other acts of physical violence. Although the legal definition varies by country, it is understood to refer to unwelcome and unreasonable sex-related conduct. A fairly comprehensive definition considers sexual harassment as “any unwelcome sexual advance, request for sexual favor, verbal or physical conduct or gesture of a sexual nature, or any other behavior of a sexual nature that might reasonably be expected or be perceived to cause offense or humiliation to another. Such harassment may be, but is not necessarily, of a form that interferes with work, is made a condition of employment, or creates an intimidating, hostile, or offensive work environment” [2].
Acts of sexual violence are always considered to be sexual harassment (as well as criminal acts). Suggestive jokes or insulting remarks directed at one sex may be considered sexual harassment in the legal sense, but not always, depending on context and frequency. And there is not a clear line between annoying courtship overtures and sexual harassment. Quantifying the severity of sexual harassment is even more challenging, as people react differently to objectively identical treatment. Furthermore, women tend to apply the term sexual harassment to more severe forms only, such as sexual violence [3].
Survey evidence documenting that sexual harassment is widespread has been important to the development of sexual harassment law. But survey methodologies differ widely, and, even among studies with representative samples, estimates of the prevalence of sexual harassment vary considerably.
Surveys use two methods to elicit responses on experiences of sexual harassment: direct query, in which respondents are asked to report whether they have been sexually harassed according to their own perception of what behaviors constitute harassment; and a behavioral experiences survey, which asks respondents to indicate whether they have experienced any of the behaviors on a list identified by the researchers as sexual harassing behavior [3], [4]. Among other questions, respondents to behavioral surveys are typically asked to report whether they have experienced any of the following unwanted or uninvited behaviors within a specified time period: sexual teasing, jokes, remarks, questions; sexual looks, gestures; deliberate touching, leaning, cornering; pressure for dates; letters, calls, sexual materials; stalking; pressure for sexual favors; and actual or attempted rape or assault [1]. A meta-analysis using 55 probability samples (random selection) for the US finds that the reported incidence is about double when based on a behavioral survey (58%) than on direct query (24%) [4].
In addition to differences in reporting methods, surveys differ substantially in time period covered and population surveyed. The time periods requested for reporting sexually harassing behavior vary among studies from as little as three months to any past experience with no time limit. Some surveys are based on national samples, but more common are surveys of subgroups such as workers in specific occupations, industries, or workplaces [5].
Figure 1 reports representative sexual harassment rates from surveys conducted in Europe and the US [1], [5]. Two points are obvious. First, sexual harassment, especially of women, is common. For example, based on surveys in 11 northern European countries, 30–50% of women and around 10% of men have experienced workplace sexual harassment. Second, sexual harassment rates vary widely. A national survey of women in Austria found that 81% had been sexually harassed, whereas one national survey of women in Sweden found that only 2% had been harassed. Differences between countries may reflect cultural differences in what behaviors are perceived as sexual harassment, but much of the variation is likely due to differences in survey methodology, sampled populations, and time period covered. For example, another national survey of women in Sweden found that 17% had been harassed. The two studies used different methodologies, with the 17% rate based on a behavioral experiences questionnaire listing a number of behaviors and the 2% rate based on a single question of whether the respondent had been sexually harassed.
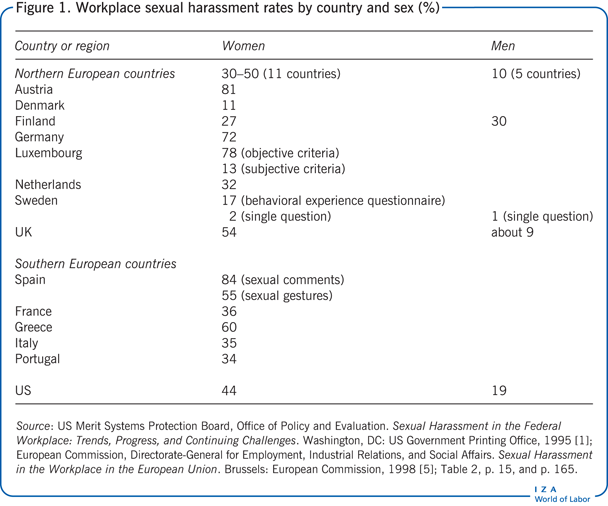
Methodological differences limit the ability to make cross-country comparisons or to identify trends. The most reliable trend evidence is from a survey of US government workers conducted using the behavioral experience methodology in 1980, 1987, and 1994 [1]. The share of both men and women who considered various behaviors to be sexual harassment increased over the period. For instance, in 1980, 62% of women and 53% of men considered sexual teasing, jokes, and remarks to be sexual harassment. By the 1994 survey, 83% of women and 73% of men considered these behaviors to be sexual harassment. Despite (or perhaps because of) increasing awareness, the share of respondents who reported that they had experienced sexual harassment did not decline over the period, with rates for women of 42% in 1980 and 1987 and 44% in 1994 and rates for men of 14–15% in 1980 and 1987 and 19% in 1994.
Although both men and women are sexually harassed, international survey data show that a majority of victims are women. Victims are more likely to be younger, hold lower-position jobs, work mostly with and be supervised by members of the opposite sex, and, for female victims, work in male-dominated occupations [1], [5], [6]. Vulnerable populations such as migrant workers are especially subject to sexual assault and other forms of abuse and violence [6]. Sexual harassment of women is particularly high in the military [4].
Records of legal charges of sexual harassment provide further information on characteristics of victims. The rate of sexual harassment per 100,000 workers calculated from charges filed with the US EEOC exhibits substantial variation by industry, age, and sex. Women are at far greater risk of sexual harassment than men in every industry and at every age [7]. For both men and women, the risk is highest for those ages 25–44. The risk of sexual harassment is higher for women in male-dominated industries, but the risk for men does not vary with the sex composition of the industry. The sexual harassment rate for women in the female-dominated industries of education and health services is low but about double the rate for men in those industries. The rate for women in the male-dominated mining industry is 71 cases per 100,000 female workers, which is 31 times the male rate [7].
Based on these legal charges filed with the US EEOC, Figure 2 shows the rate of sexual harassment charges per 100,000 female workers by age group for four selected industries. The inverted U-shaped pattern shows a rise in legal charges up to ages 25–44 and a decline thereafter. This pattern also holds for women in other industries and for men in many cases, although the sexual harassment rates for men are uniformly well below those for women [7].
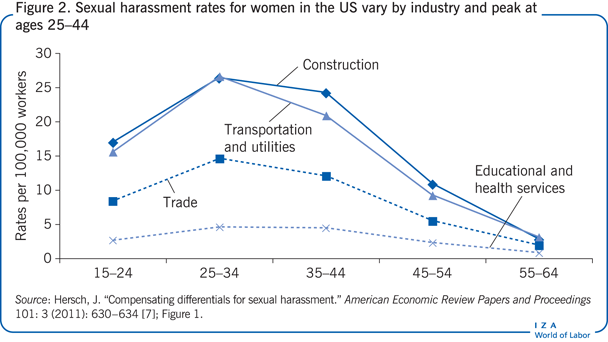
Before policies can be developed to end sexual harassment, policymakers need to know whether sexual harassment reflects individual behavior or whether certain organizational characteristics are more conducive to such behavior. Empirical studies consistently document that a majority of harassers are male and more likely to be at the same or at a higher organizational level than their victims. There is little other evidence of a pattern by social status, occupation, or age, making it difficult to identify likely harassers [1], [8].
A body of literature identifies organizational characteristics that create an environment in which sexually harassing behavior can exist. Key characteristics include an organization’s tolerance for sexual harassment and the gender composition of the workplace, which includes factors such as the sex of the supervisor and whether an occupation is considered traditionally male [9], [10]. Sexual harassment is more prevalent in organizations with larger power differentials in the hierarchical structure, and in male-dominated structures like the military [4].
Under US employment law, sexual harassment is a form of sex discrimination because it alters the “terms, conditions, or privileges of employment” on the basis of sex and interferes unreasonably with workers’ ability to perform their jobs [7]. The productivity and pay of victims of sexual harassment, as well as of their co-workers, are expected to be lower if sexual harassment induces inefficient turnover, increases absenteeism, and generally wastes work time as workers attempt to avoid interactions with harassers.
Those who are sexually harassed report a wide range of negative outcomes. There is extensive evidence of lower job satisfaction, worse psychological and physical health, higher absenteeism, less commitment to the organizations, and a higher likelihood of quitting one’s job [1], [5], [9], [10]. Among US federal government workers, 21% of those who have been sexually harassed report that their productivity declined as a consequence [1]. Workers who report sexual harassment are also at risk of retaliation, which results in even lower job satisfaction and worse psychological and health outcomes [11].
Because workplace sexual harassment reduces worker productivity, victims may have lower earnings. But sexual harassment is universally considered an extremely negative working condition, which suggests that a pay premium may arise for this type of working condition, similar to the premiums in jobs in which workers face a high risk of death or injury, risks that are also costly for firms to eliminate. Thus, the direction of the relation between the risk of sexual harassment and earnings is not predictable a priori. And there is only limited evidence on whether earnings are affected by experiences of sexual harassment or not. Analysis of sexual harassment charges filed with the US EEOC shows that workers are paid a premium for employment in jobs with a higher risk of sexual harassment: $0.50 an hour for men and $0.25 an hour for women for workers with an average risk of sexual harassment relative to those with zero risk [7].
The adverse consequences for victims of sexual harassment translate into a less productive work environment. The costs to organizations include increased turnover and absenteeism, lower individual and group productivity, loss of managerial time to investigate complaints, and legal expenses, including litigation costs and paying damages to victims.
The study of sexual harassment of US government workers estimated the costs of sexual harassment over a two-year period at $327 million, including job turnover, sick leave, and individual and workgroup productivity, with 61% of the total cost due to reduced workgroup productivity [1]. The reduction in individual and workgroup productivity is estimated to cost organizations an average of $22,500 per person affected by sexual harassment according to a meta-analysis of 41 US studies with nearly 70,000 observations [10].
A study in the food services industry found that overall team financial performance is lower, and relationship conflicts (personality clashes) and task conflicts (workgroup disagreements about how tasks should be done) are higher, in work groups with higher levels of sexual hostility (verbal and nonverbal behaviors that discriminate on the basis of gender) [12]. In 2014, the US EEOC resolved 7,037 charges of sexual harassment yielding monetary benefits to the harassed employees of $35 million excluding any benefits obtained through litigation.
Organizational tolerance of sexual harassment is the most important influence on whether sexual harassment occurs in a workplace. But there has been little empirical research on which policies and procedures are effective in creating an organizational climate in which sexual harassment is not tolerated [10].
Training in what constitutes workplace sexual harassment and in the organization’s policies toward sexual harassment has been shown to increase the probability that workers, especially men, will identify unwanted sexual behaviors such as touching as sexual harassment [13]. Workers who become more aware of what behaviors constitute sexual harassment may be motivated to avoid such behaviors as well as to enforce that norm in their workgroup.
Although empirical evidence on the efficacy of workplace policies in reducing sexual harassment is limited, there is consensus on what works best. In addition to training, organizations should emphasize prevention by issuing strong policy statements of no tolerance of sexual harassment and by providing a safe mechanism for complaints of sexual harassment with protections against retaliation. Many workplaces also offer counseling and support to victims. Having a training program and a safe and clear complaints procedure may also protect the organization against legal liability [6].
When identifying behaviors that constitute sexual harassment, care should be taken to avoid defining it so broadly as to cause work relations to break down because co-workers fear being accused of sexual harassment for behavior intended as collegial or friendly. Creating such an atmosphere of distrust and ambiguity may also adversely affect productivity. The survey of US government workers reports that nearly half the men expressed concern that giving compliments might be misinterpreted as sexual harassment. However, relatively few workers—18% of men and 6% of women—reported that fear of being accused of sexual harassment made their workplace an uncomfortable place to work [1].
A global study of laws in 100 countries protecting women against violence found that 78 have laws regulating workplace sexual harassment (Figure 3) [2]. In all regions except the Middle East and North Africa, a majority of countries have such laws, including all high-income OECD countries except Japan, and 21 of the 26 countries in Sub-Saharan Africa. In contrast, only Algeria and Morocco among the 10 economies in the Middle East and North Africa have laws against workplace sexual harassment.
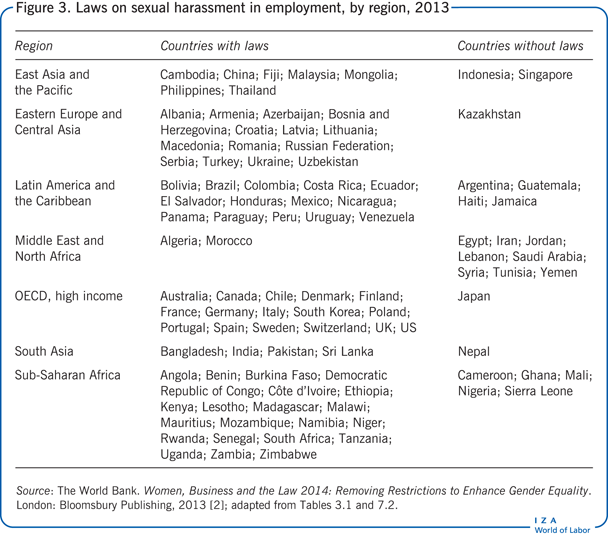
Depending on the country, sexual harassment may be covered under a range of legal principles: as employment discrimination on the basis of sex, under labor law protections against unfair dismissal, under human rights law, under health and safety laws requiring provision of a safe working environment, under criminal law (especially for sexual assault), as a tort (an intentional act for which courts can grant damages awards), and under contract law (such as breach of contract against unfair dismissal) [6]. Judicial decisions have been instrumental in defining sexually harassing behaviors and in assigning liability and remedies. In the US, sexual harassment is covered under employment discrimination law as a form of discrimination on the basis of sex. The legal tradition in Europe, while also recognizing sexual harassment as employment discrimination, has emphasized the harm caused by sexual harassment to the dignity of men and women at work [5].
The efficacy of such laws depends on the reporting of sexual harassment by victims and others affected by the harassing behavior. Yet sexual harassment is seriously underreported [5]. More than 90% of US government workers who had experienced sexually harassing behaviors did not take formal action (notably half did not do so because they did not consider the harassment to be serious) [1]. The low rate of legal charges filed with the US EEOC in comparison to the high rate of sexual harassment reported in surveys indicates that very few victims pursue formal legal remedies [7]. The decision not to report is often justified by concerns about retaliation and the consequent effect on job satisfaction [11].
The threat of legal action can reinforce organizational incentives to eliminate sexually harassing behavior. However, the probability that sexually harassing behavior will lead to a lawsuit is quite low, further reducing the efficacy of laws [7].
Sexual harassment encompasses a wide range of behaviors and is not easily defined. Survey evidence has been instrumental in raising public awareness about the extent of workplace sexual harassment. The substantial evidence that sexual harassment is frequent and damaging to individuals and workplaces has led to widespread legislation and workplace policies.
However, the survey instruments differ widely in design from study to study, as do the sampled populations. Existing data do not permit making valid cross-country or cross-cultural comparisons or even identifying trends within a country. The limited reliable trend evidence indicates that sexual harassment has not declined, but whether that is due to increased awareness of what behaviors constitute sexual harassment or to no actual change in harassing behavior is uncertain [1]. In addition, the trend data are now outdated, with the most recent survey conducted in 1994 [1].
The connection between sexual harassment and other forms of workplace harassment, including bullying, warrants further examination. Little is known about the characteristics and motivation of harassers and therefore little is known about how to prevent harassment. And although sexual harassment is found to be more likely when organizations tolerate such behavior, there is little specific empirical evidence on what organizational policies or actions are effective in eliminating sexual harassment.
The main puzzle, though, is why sexual harassment in the workplace survives. Because sexual harassment is costly to workers and organizations and is also illegal, there are market and legal incentives to eliminate this behavior. Offsetting these incentives, however, are costs of monitoring and enforcing behavior coupled with low reporting of sexual harassment, which reduce any litigation threat. Thus, tolerance of sexual harassment may be efficient within many workplaces. Research could be productively directed at examining sexual harassment in a broader framework that incorporates market and legal incentives and identifies policy levers that would enhance incentives to comply with laws against sexual harassment.
Workplace sexual harassment is costly to workers and organizations and is legally prohibited in more than 75 countries. Workers who are sexually harassed have lower job satisfaction and suffer a range of negative psychological and physical health consequences. Sexual harassment reduces individual and group productivity. Yet survey evidence shows that workplace sexual harassment is quite common. It is also substantially underreported, in part because workers are justifiably concerned that reporting may lead to retaliation and an even worse work environment.
Three approaches are available to reduce the incidence of workplace sexual harassment. First, because sexual harassment lowers workplace productivity, and because workers are paid a premium for exposure to the risk of sexual harassment, organizations should respond to these market incentives by striving to eliminate sexual harassment. However, because market incentives are apparently insufficient to eradicate sexual harassment, efforts to raise the costs to organizations of tolerating an adverse work environment may be effective. For example, firms that are publically identified as tolerant of a sexually harassing environment may need to raise the pay premium necessary to attract workers.
Second, legislation prohibiting workplace sexual harassment is widespread, but that too has been inadequate to eliminate it. Enforcement of laws relies on reporting, and therefore underreporting weakens the efficacy of laws. Policies directed at increasing reporting may help support law enforcement and could also reinforce the incentives provided by the market.
Third, although empirical evidence is limited, widely accepted best practices involve the promulgation of a strong policy prohibiting sexual harassment, workplace training, and a complaints process that protects workers from retaliation.
The author thanks an anonymous referee and the IZA World of Labor editors for many helpful suggestions on earlier drafts. The author also thanks Kathryn H. Anderson, Blair Druhan Bullock, and W. Kip Viscusi for helpful discussions.
The IZA World of Labor project is committed to the IZA Guiding Principles of Research Integrity. The author declares to have observed these principles.
© Joni Hersch
https://wol.iza.org/articles/sexual-harassment-in-workplace/long
Cash transfers can reduce child labor if structured well and if they account for the reasons children work
Cash transfers are a popular and successful means of tackling household vulnerability and promoting human capital investment. They can also reduce child labor, especially when it is a response to household vulnerability. But if not properly designed, cash transfers that promote children’s education can increase their economic activities in order to pay the additional costs of schooling. The efficacy of cash transfers may also be reduced if the transfers enable investment in productive assets that boost the returns to child labor. The impact of cash transfers must thus be assessed as part of the entire social protection system.
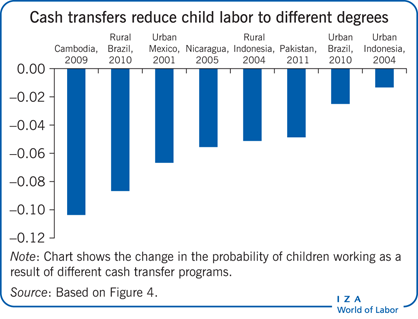
Cash transfers can reduce the economic vulnerability of households and increase human capital investment, especially in low-income countries with weak social protection systems.
Cash transfer programs have proven to be valuable in reducing child labor that arises as a response to household vulnerability.
Adding interventions to reduce the costs of school and health care and improve their quality can increase the effectiveness of cash transfers in reducing child labor.
If invested in productive assets, cash transfers can increase household demand for child labor.
If cash transfers enable children to enroll in school, child labor might increase to support additional education costs.
Few cash transfer programs have reducing child labor as a primary objective.
In most cases, increases in school attendance are not fully matched by reductions in child labor.
Evidence shows that cash transfers can address child labor by reducing household vulnerability, but there is considerable variation in impact. Differences in program design are one reason. Another is that the effects on child labor may be dampened by the need to pay additional costs if the transfers enable children to go to school. There may also be incentives for increased child labor if transfers invested in productive assets increase the returns to children’s work. Thus, adding interventions to reduce the costs and improve the quality of school and health care are a promising complement to cash transfer programs.
Social protection policies such as cash transfers seem to be an obvious way to reduce child labor. Cash transfers aim to relieve household economic hardship by providing income support. By easing the economic vulnerability of households, cash transfers can remove some of the reasons that children work. Cash transfer benefits are often coupled with incentives for behavioral change, as in the case of conditional cash transfers that include conditions for children’s education or health care.
Cash transfers can have complex effects on household behavior that go beyond easing budget constraints. For example, if cash transfers change the relative prices of children’s time use (in work and schooling), that may affect a household’s decision to send a child to school. School attendance requires the commitment of a certain amount of a child’s time and incurs some fixed costs, which are likely to change the financial constraints facing the household. Also, the household might use part of the transfer for investments in productive assets instrumental to farming or small business activities, such as fertilizer, plows, or sewing machines, which can make it more profitable for children to work. Both of these mechanisms make the effect of cash transfer programs on child labor uncertain.
This paper discusses some of the potential benefits and limitations of cash transfers for vulnerable households, drawing on extensive evidence from impact evaluations. While this does not exhaust the evidence on this topic, focusing on impact evaluations means relying on statistically solid information generated by actual cash transfer programs. Also, there are limits to what cash transfers and, more generally, social protection programs can do to reduce child labor. Access to and the quality of education, returns to education, and access to good jobs after graduation are a few of the variables that also shape household decisions affecting children’s work.
Child labor (a subset of child work that is not allowed according to national and/or international regulations) is a legal rather than a statistical concept. Translating broad legal norms established in international agreements into statistical terms for measurement purposes is not straightforward. The international legal standards contain a number of flexibility clauses that are left to the discretion of national authorities. Hence there is no global legal definition and is no standard statistical measure of child labor.
Consequently, the terminology and concepts used to categorize children’s work and child labor (and to distinguish between the two) are at times inconsistent in published studies [1]. Similarly, there is substantial variation in the productive activities covered by the studies considered here. Some focus on specific activities (such as work in agriculture), whereas others use a broader definition of work (such as work in economic activities). There is also variation in reference periods. Finally, some studies focus on how many children work and some on how much children work.
By the latest International Labour Organization estimates, more than 120 million children aged 5–14 were engaged in labor in 2012; this is about 10% of children in this age group. There are many causes of child labor, with household economic vulnerability being the principal one [2]. Poor households with inadequate resources and no access to credit markets are likely to make inefficiently low investments in their children’s education and to let their children work at an early age. Lack of access to financial and insurance markets also makes households more vulnerable to the effects of income losses. One of the coping strategies is to withdraw children from school and send them to work.
Two figures illustrate these points both across and within countries. Figure 1 presents correlations between income per capita and child labor for children ages 7–14 (as proxied by participation in economic activities) for a large group of countries. Figure 2 presents the difference in the incidence of child labor across five income groups (quintiles) in selected countries. Both across and within countries, the link between poverty and child labor emerges clearly. Countries with higher GDP per capita tend to have a lower incidence of child labor (Figure 1), while within countries children in the poorest households engage in economic activities at a substantially higher rate than children in higher income groups (Figure 2). It is also clear, however, that poverty is not the only cause of child labor, as illustrated by the high variation in the incidence of child labor for similar income levels across countries, and by some incidence of child labor even in the top part of the income distribution within countries.
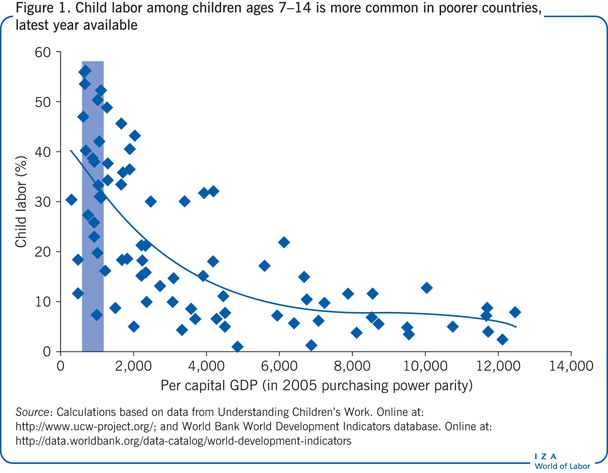
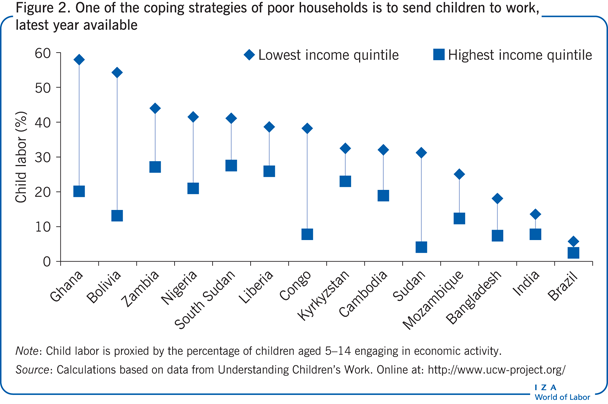
Social protection policies are thus an obvious potential means of addressing some of the factors driving child labor. By alleviating the economic vulnerability of households, social protection policies may remove some of the reasons that families send their children to work.
Transfer programs aim to relieve economic vulnerability by increasing household income. The cash transfers are often accompanied by certain behavioral requirements, or conditions (conditional cash transfer programs). For example, some conditional cash transfer programs require that beneficiaries send their children to school or take them regularly to health clinics.
Cash transfers can have complex effects on household behavior through two mechanisms. They can affect child labor by modifying children’s likelihood of attending school or by changing the returns to child labor [3]. First, cash transfers may change how households value children’s use of time, encouraging them to send children to school and thus to work less or not at all. However, school attendance requires the commitment of a set amount of a child’s time and also increases household spending on education [3]. Thus, deciding to send a child to school is likely to affect the household budget (more costs for school and less income from child labor). Second, if the household uses part of the cash transfer to invest in assets that make child work more productive (and thus more profitable), the transfer could increase the value of children’s work to the household. Both these mechanisms make the likely effect of cash transfer programs on child labor uncertain.
Because school attendance generally requires a fixed minimum time investment (it is not usually possible to choose the number of hours a child will spend in school), a child who begins to attend school following a cash transfer will have less time for leisure and work. Moreover, the household faces some fixed costs to send a child to school (school fees, uniform, travel costs). The final impact on child labor depends on whether the amount of the cash transfer exceeds the cost of attending school. If the transfer falls short of the monetary cost of sending a child to school, the resulting change in child labor is ambiguous because both consumption and leisure would be reduced by sending a child to school. If the transfer exceeds the cost of sending the child to school, then consumption can also increase and child labor should decrease as the household can improve its condition without relying on the child’s earnings.
This conclusion holds only if the household uses the cash transfer to finance consumption or education. However, because money can be spent in many different ways, the additional resources could be used instead to invest in productive assets. Such investments could increase the returns to child work directly if the child works in the household business or farm and productivity in these activities increases as a result of the investment. They could also increase the returns to child work indirectly, through changes in the adult labor supply—for example, if household members devote more time to productive activities and less time to household chores, children’s time will become more valuable in household chores. While there is evidence that cash transfers are used in this way, to invest in productive assets, there has been only limited analysis of the consequences of this choice for child labor (see, for example, [4], [5], [6], [7] and the literature cited therein).
In general, impact evaluations find that both unconditional and conditional cash transfers can reduce child labor (Figure 3 and Figure 4). There are, however, large variations in the effects of different cash transfer programs, and for several programs, no significant impact could be identified.
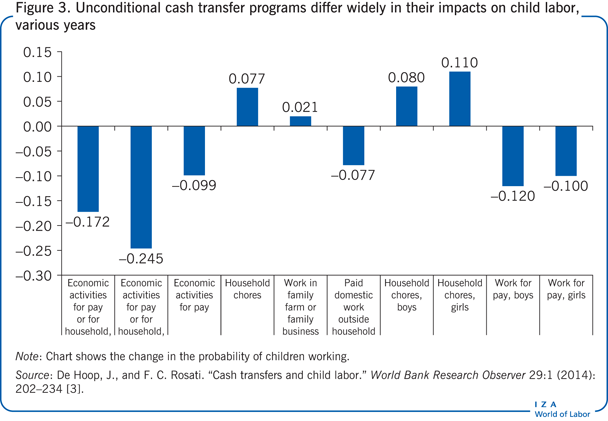
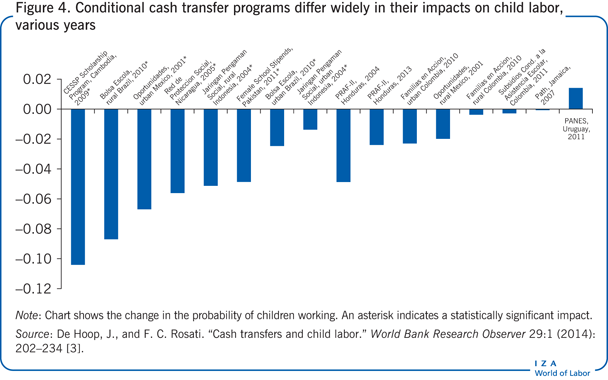
It is not easy to identify the factors that are associated with the observed differences in the impact of cash transfer programs on child labor. A large part of the variability could be due to program characteristics that are difficult to capture in a comparative analysis. Nonetheless, some general points can be derived from the analysis that could inform program design so as to make cash transfers more effective in reducing child labor.
First, the impact on child labor does not precisely mirror the increase in school attendance generated by cash transfer programs: the increase in school attendance is generally much greater than the reduction in child labor. Within the set of conditional cash transfer programs considered in Figure 4, a one percentage point increase in school attendance is accompanied by only a 0.3 percentage point reduction in children’s work [3]. This is not surprising, since school and work are not mutually exclusive (for example, children can work after school or during school holidays, or miss some classes for work). Nonetheless, working while attending school is potentially detrimental to educational achievement and grade completion.
There are other reasons why increases in school attendance are not fully matched by reductions in child work. A key reason is that cash transfers can increase household investment in productive assets used in economic activities, such as in farming and small businesses. While there has been little direct examination of the impact of this mechanism on child labor [7], impact evaluations of microcredit programs find that households’ increased involvement in productive activities can lead to increases in child labor, as has been the case with microcredit programs in Bosnia, Thailand, and Bangladesh [8], [9], [10].
A second important point is that additional resources beyond the amount of the cash transfers might be needed to help households pay for the increased costs associated with sending a child to school. Without such additional resources, children who were working and begin to attend school might not stop working, or children who begin to attend school might also begin to work to help the household meet the additional expenses. Evidence of these types of effects have been found for the Bright program in Burkina Faso (designed to improve access to quality education for girls) and the Pantawid Pamilyang Pilipino Program (4Ps) in the Philippines (a conditional cash transfer program to eradicate extreme poverty by investing in children’s health and education). In both programs, school attendance increased but was not associated with a reduction in child labor. In fact, involvement in child labor increased, especially among children who began to attend school following household participation in the program.
Conditions were introduced to transfer schemes with the intention of improving their effectiveness and ensuring that the benefits were used, at least in part, to improve children’s human capital. Common conditions in cash transfer programs require that participating households send their children to school regularly and take them in for regular health checks. Conditions have not addressed child labor participation because reducing child labor has not been a direct objective of most cash transfer programs (although participation of children in work has been a criterion for identifying households to receive benefits).
There are obvious reasons why conditions have not been imposed on child work. For instance, school and health clinic attendance are easy to monitor using school or clinic records. Objective verification of child work, by contrast, would be very difficult since most children who work are engaged in family businesses or in the informal sector, often in violation of national law. Monitoring would have to rely on statements by parents and children, which could be unreliable in these circumstances.
While evidence suggests that conditional cash transfers have a stronger impact on school participation than unconditional cash transfers do, whether the conditions related to child education reduce child labor has been much more difficult to assess. First, the decision to include an education condition in a program might depend on the expected impact of the program on the target population (meaning that the condition is endogenous, making assessment of impact difficult). Most studies do not specify the precise conditions attached to the delivery of the services or provide information on the degree of enforcement of the conditions, thus making straight comparisons of effectiveness difficult.
A few studies, however, offer some evidence in this area [11], [12]. The studies use variations in implementation of Ecuador’s Bono de Desarrollo Humano cash transfer program that, according to official reports, led some participating households to believe incorrectly that the cash transfers were conditional on children’s school attendance. The effect of the program on child labor was similar in households that believed that the program was conditional on school participation and in households that did not [3]. In both groups of households, child labor decreased.
Recent discussions of cash transfer programs have focused on whether conditions make a difference in the effectiveness of the programs or whether other approaches could achieve better results. One study of the Tayssir program in Morocco examined whether a cash transfer program open to all poor households without conditions could be as effective in increasing school enrollment as traditional targeted and conditional programs. Enrollment for the unconditional program was school-based, thus conferring an implicit endorsement of education. The study asked whether “a ‘nudge’ may be sufficient to significantly increase human capital investment, while [conditional cash transfer programs] as currently designed provide a big shove” [13]. The results show that a rural cash transfer program simply “labeled” as supporting education had a large impact on school participation even though the transfer was not conditional on school attendance. This has relevance for the case of child labor, where imposing explicit conditions might not be feasible.
The impacts of cash transfer programs on child labor appear to be greater when cash transfers are complemented by interventions that reduce the costs of health care and education services or improve their quality [1]. Some other cash transfer programs have focused on both safety net provision and active poverty reduction by including support for household income-generating activities through grants or loans to buy investment goods. These programs seem to have a smaller impact on child labor, confirming that interventions that increase household economic activity tend to generate greater demand for children’s work.
Cash transfer programs seldom have the reduction of child labor as a primary objective, and so impact evaluations rarely assess this outcome in depth. As a result, little is known about which program characteristics affect child labor. The role of the design elements that have been tested appears to be limited. There is little evidence that conditions that mandate that children attend school affect the programs’ impact on child labor. The size of the transfer relative to household income also appears to have little influence in reducing child labor. Some conditional cash transfer programs that transfer substantial sums of money have had no effect on child labor, whereas other programs that provide only a small subsidy have resulted in large changes.
Another key issue concerns measurement of child labor. Only a few studies have examined the extent to which cash transfers prevent and reduce the worst forms of child labor, including hazardous work and long working hours, which can interfere with learning in school. Similarly, cash transfer programs appear to be more effective in reducing child work in economic activities, typically engaged in by boys, than in household chores, typically engaged in by girls. However, studies that look at impacts on child labor tend to focus solely on children’s economic activities. Few studies have documented changes in household chores as a result of cash transfer programs, thus underreporting the effects of programs on girls. This is an important oversight as many girls can be attending school while burdened by a heavy load of household tasks, compromising learning and leading to early drop out.
Vulnerability is not the only cause of child labor, and therefore social protection policies such as income transfers are not the only relevant policies for reducing child labor. Poor access to education, low returns to education, and high demand for unskilled labor are other possible reasons for child labor. Therefore, policies aimed at addressing constraints to human capital investment are also relevant for addressing child labor.
Because cash transfer programs are generally part of broader social protection systems that include other components, ranging from health insurance to other targeted transfers or subsidies, their full potential can be determined only by evaluating them in the context of those broader social protection systems. Moreover, the source of financing is seldom considered in discussions of the effectiveness of cash transfer programs, but that is clearly relevant in determining their effects on child labor and other outcomes. Most studies assume, mainly implicitly, that funding is made available from outside the system and that changes in revenue or debt necessary to finance the program do not affect the target population. While this might be the case for small pilot programs, it cannot be so for large programs (like Mexico’s Prospera I and Brazil’s Bolsa Familia). In short, while impact evaluations provide a sense of the changes induced at the margin by a cash transfer program, any full assessment of their effectiveness requires consideration of the program’s source of financing and its integration with the rest of the social protection system, which has not yet been done.
Finally, while the results discussed here can improve the effectiveness of cash transfer programs, the main problem facing vulnerable households is the lack of scale of many social protection interventions, especially those targeting families with children.
Cash transfer programs have the ability to reduce child labor, especially in low-income countries and in countries where social protection systems are weak. Providing a safety net to vulnerable households that lack access to capital markets reduces their use of child work as a coping mechanism.
Evidence from impact evaluations shows that cash transfers are especially relevant if well targeted to the most vulnerable households whose children are at risk of missing school or working. For programs that address large numbers of households with children who are not working, the effects are more diluted.
There are also theoretical reasons, supported by some evidence, pointing to a smaller impact of cash transfer programs on child labor through schooling. The need to finance additional education expenditures, as well as the increased returns to child work when transfers are used to invest in productive assets, might dampen the effects of these programs.
Additional elements could be incorporated in cash transfer programs to deal with these problems and make them more effective. While adding conditions on child labor does not appear feasible, adding measures that reduce the costs of school and health care and improve their quality looks like a promising approach. Adjusting the level of transfers, especially through scholarships, might also be needed to ensure that households can afford the additional costs of sending children to school.
More complex is the problem of the increase in the returns to child work due to investments in household productive activities. Public information campaigns could provide households with information on the risks of children’s early involvement in work and on the real return to education (including to the family business). In middle-income countries, cash transfer programs could, for instance, be complemented with services to help youth find profitable employment after graduation, thus increasing the expected returns to education.
The author thanks an anonymous referee and the IZA World of Labor editors for many helpful suggestions on earlier drafts. Previous work of the author contains a larger number of background references for the material presented here and has been used intensively in all major parts of this article [1], [3].
The IZA World of Labor project is committed to the IZA Guiding Principles of Research Integrity. The author declares to have observed these principles.
© Furio C. Rosati
https://wol.iza.org/articles/can-cash-transfers-reduce-child-labor/long
The occupational status of most immigrants initially declines but then increases
Evidence suggests that immigrants face an initial decline in their occupational status when they enter the host country labor market but that their position improves as they acquire more country-specific human, cultural, and occupational capital. High-skilled immigrants from countries that are economically, linguistically, and culturally different from the host country experience the greatest decline and the steepest subsequent increase in their occupational status. In the context of sharp international competition to attract high-skilled immigrants, this adjustment pattern is contradictory and discourages potential high-skilled migrants.
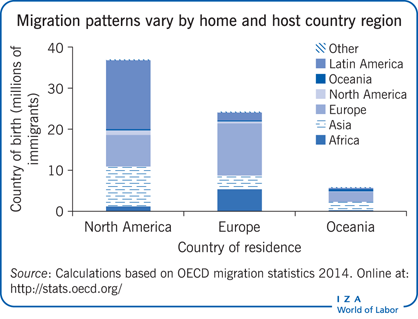
After a sharp initial decline, high-skilled immigrants experience a steep increase in their occupational status.
Proficiency in the dominant language in the host country is a key variable facilitating skill transferability.
High occupational mobility is desirable because it can attract high-skilled workers and lead to efficiency gains and stable careers.
High occupational mobility enables a rapid response to temporary shortages in occupation fields.
Migrants’ skill transferability is hampered by differences in institutions, cultural norms, and technologies between home and host countries.
Language deficiency can motivate return migration or circular migration, even of high-skilled migrants.
Low occupational mobility leads to occupational mismatch and persistent over-education, pushes immigrants into the social welfare system, and depresses wages.
Low occupational mobility can discourage high-skilled immigration.
Migrants’ occupational mobility is related to cultural and linguistic similarities between home and host countries, migration motives, and occupational skills. Most migrants experience an initial decline in occupational status followed by a rise. Declines are steepest for high-skilled migrants from developing countries with no historical ties to the host country. Skill transferability is facilitated by language proficiency and impeded by occupational barriers and lack of country-specific capital. Policies should help migrants invest in country-specific capital, such as learning the language and the formal and social codes of relevant occupations.
In the age of globalization, growing numbers of people move to another country either temporarily or permanently. Recent migration flows are dominated by refugees, labor migrants, and their family members. Although migration is a constant in human history, many contemporary immigrant workers face serious problems of skill transferability in advanced labor markets, where skills are highly formalized and often country-specific. Immigrants usually experience a skill-degradation upon arrival: they enter lower-skilled occupations than those they pursued in their home country.
Occupational mismatches are a serious concern because they are associated with significant socio-economic costs for workers, firms, and national economies. Immigrants from developing countries are the most affected, often experiencing social, economic, and spatial integration problems in host countries. For workers, the lower returns to skills have long-lasting effects on their socio-economic and health status as a result of lower job satisfaction, frustration, and unstable careers. For firms, the lower returns to skills are associated with lower employee motivation and productivity and higher turnover rates, leading to higher costs for screening, recruiting, and training. For national economies, inefficiencies in matching lead to higher unemployment and place extra burdens on social welfare systems. The social costs of the mismatch are possibly even higher.
The occupational adjustment of immigrants is a pivotal mechanism in immigrants’ labor market performance. Human capital (schooling and job experience) is occupation specific, and occupations, to a large extent, determine earning levels [1]. The costs of changing occupation are high, so most workers tend to avoid doing so. Occupational mobility is higher in flexible labor markets, such as the US, while it is relatively low for tightly regulated labor markets, as in Europe. In regulated markets, the basic requirements to qualify for an occupation are usually narrowly defined, including years and type of formal education completed and years of experience, which potentially impedes mobility between different types of jobs and occupations [2].
In today’s labor markets, new jobs are increasingly high-skilled and require strong cognitive skills, including interpersonal interactions, language facility, cultural capital, and social relations [2], [3]. Workers are expected to follow implicit social norms and to be proficient in the common local language and the communication skills needed to function in a complex organizational structure. For immigrants, other invisible barriers include lack for familiarity with labor market, occupational, and other institutions and task-specific skills in the host country. As a result of all of these factors, some immigrants in countries with generous welfare programs may not be motivated to look for work. In this context, immigrants are less likely to be employed and to be occupationally mobile.
Empirical studies have examined the occupational adjustments of immigrants by applying the concept of over- and under-education, based on the assumption that each occupation has a reference level of education. Workers whose education level is above the reference level are considered over-educated, while workers whose education level is below the reference level are considered under-educated. Several approaches have been applied to examine education–occupation mismatches. Some studies use a worker’s self-assessment of how well their education matches the required education for the job. Others apply the “realized matches” approach, which relates actual education level to the mean education level for each occupation, a regularly used reference level [4]. Still other studies apply composite measures of occupational outcome, such as the International Socioeconomic Index of occupational status and the Erikson-Goldthorp class categories, which capture relative differences in power relations at the workplace, prestige, educational requirements, and earnings [2]. The evidence suggests that the choice of methodology has little impact.
A theoretical and empirical regularity appears in studies for Australia, Canada, New Zealand, the US, and European countries: immigrants start at the lower end of the occupational distribution after arrival and subsequently increase their occupational status as they acquire more host-country-specific capital [2], [3], [4], [5], [6], [7], [8]. These studies find that immigrants entering host country labor markets and navigating across jobs follow a particular pattern that is associated with similarities in language, culture, and educational and labor market institutions between their home and host country.
Immigrants have a limited set of job opportunities when they first enter the labor market in the host country. Their occupational mobility is blocked by formal barriers (such as required licenses, credentials, certifications) and a lack of country-specific capital because of linguistic deficiencies, lack of familiarity with cultural and social norms, limited access to effective search channels, and so on. In such an environment, immigrants tend to accept less desirable jobs involving more repetitive and manual tasks and a lower degree of cognitive skills (analytical, interpersonal, and linguistic skills) [3].
The theoretically predicted improvement in the occupational status of immigrants over time seems to be obstructed in countries where the labor market is relatively rigid and welfare programs are less developed than in Western European countries. An example is Spain, where higher-educated immigrants, including Spanish-speaking immigrants from Latin America, experience little improvement in their occupational status over time in the Spanish labor market [9].
Formal schooling and job experience are substitutable for each other in many jobs. Labor market entrants take jobs for which a lower level of education is required. As they gain experience, they climb the occupational ladder quickly. In contrast, older workers tend to have less schooling than entrants but more experience within the occupations they are engaged in.
Occupational skills, both formal schooling and job experience, are not perfectly transferable internationally. The degree of transferability varies across occupations, with less transferability for occupations that require a high share of country-specific capital and more transferability for occupations that entail more general skills. Consider three high-level occupations: computer programmer, psychologist, and lawyer. Of the three occupations, the skills of the computer programmer may be the most transferable since English is a common language among programmers and the programming practice is fairly similar internationally. The psychologist may need more country-specific skills, such as local language and style of practice. Legal skills are likely the least transferable across countries because of fundamental differences in legal systems, which are rooted in tradition and tied to cultural values, norms, and language.
Most immigrants experience a decline in occupational status between their last job in their home country and their first job in the host country but then see a subsequent increase in occupational status as they accumulate more host-country-specific capital. This trajectory traces a U-shaped pattern [4]. The size of the subsequent increase in occupational status is related to the size of the initial decline. The sharper the initial decline, the steeper the recovery tends to be. The depth of the U varies, however, across groups of immigrants according to the degree of similarity between home and host countries. Immigrants from countries that are culturally and linguistically similar to the host country will experience small initial declines and small subsequent increases—a shallow U. But immigrants with very different cultural and linguistic backgrounds than native-born workers will experience a steep decline and a steep increase—a deep U [2], [8].
Immigrants who experience a sharper decline in occupational status have relatively low opportunity costs (meaning that the benefits they could have gained from taking an alternative action are relatively small) of investing in host country human capital, so they quickly improve their status. The key mechanism behind this steep increase is the inclination to invest in host-country-specific skills [10]. High-skilled immigrants in less-skilled jobs will have strong incentives to acquire new complementary skills, and the opportunity costs of such investments are low because of the relatively low current return to their skills and their greater ability to learn new skills.
In advanced knowledge economies, many high-skilled jobs are associated with tacit country-specific skills [2], [3]. Cultural and social codes associated with these jobs are rarely articulated in explicit rules and yet deviations from these codes may result in rejection or exclusion. Higher-skilled immigrants from developing countries that are linguistically and culturally different from host countries likely lack these cultural codes and face a low degree of skill transferability. This is illustrated in Figure 1, which depicts, by educational status, the occupational adjustment patterns of immigrants in the Netherlands from Turkey and Morocco (Mediterranean) and from developed OECD countries (Western). Mediterranean countries are economically, culturally, and linguistically different from the Netherlands, whereas Western countries are fairly similar. This is reflected in their patterns of occupational adjustment. While almost 90% of high-educated immigrants from Mediterranean countries start with lower-skilled jobs, in subsequent years they experience a sharp increase in occupational status so that within six to nine years almost half of them have a professional job and within 15 years almost three-quarters do. The adjustment profile of Western immigrants is much shallower, with just a quarter of them starting with lower-skilled jobs, and the share with high-skilled jobs reaching 82% in three to five years and staying close to that level thereafter.
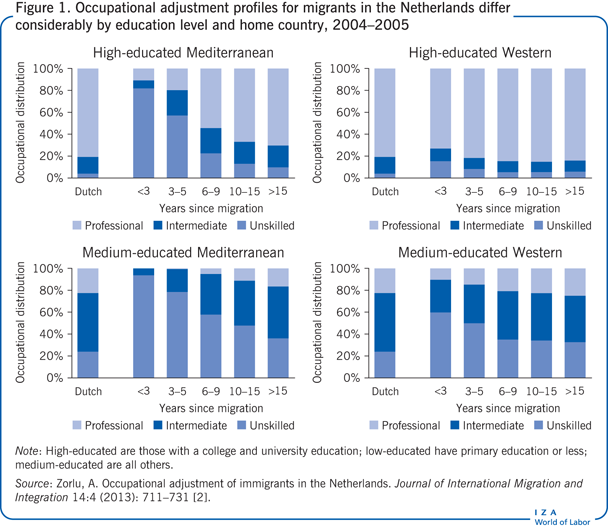
The occupational status of high-skilled immigrants with few transferable skills is expected to experience a deep U, while the occupational status of unskilled and low-skilled immigrants is expected to experience little decline in occupational status and only a small subsequent increase. Over time, all immigrants will attend additional training and accumulate host-country-specific knowledge, boosting the transferability of their original skills to the level of native-born workers in the host country.
Among immigrants, refugees generally have a larger cultural and linguistic distance from the host country because their migration is determined by (exogenous) humanitarian factors such as war and disaster, unlike the case of labor migrants, who move for economic motives. Refugees experience a sharp initial decline in occupational status and a steep subsequent recovery. Typically, their occupational skills are home-country-specific and not easily transferable to the host countries. The occupational status of migrants who move to reunite with family members abroad or to form families or partnerships will also trace a deep U pattern because their migration decisions are determined largely by family matters and their economic incentives would be less important than their desire to rejoin their family.
The empirical evidence indicates distinct occupational adjustment patterns for immigrants in European welfare states and English-speaking countries (Australia, Canada, New Zealand, the US). In European countries, immigrants, in particular high-skilled immigrants from non-Western countries experiencing a drastic initial decline in occupational status are unable to catch up to their native counterparts with the same educational level, implying long-lasting effects of the initial decline. Immigrants with fewer problems with skill transferability seem to recover after a fairly short adjustment period. By contrast, immigrants in English-speaking countries seem to quickly make up for much of the initial loss in occupational status, though this might not hold for more recent immigrants in the US because the composition has changed [11].
Mismatches of skills and jobs are caused by imperfect information. They are temporary and disappear as the information gaps between employers and employees diminish. On arrival in the host country, immigrants often take jobs requiring lower skills than their home-country occupation did. These immigrants climb the occupational ladder as they become better informed.
In principle, immigrants face intensive information problems when searching for jobs because they know little about the host country labor market institutions and because they have only weak contacts with social networks, formal mediating organizations, and other search channels. As a result, the skill and job mismatch is greater for immigrants than for native-born workers. This mismatch may be even more severe than it appears if high unemployment among immigrants discourages them from looking for work because they believe that their probability of finding a suitable job is low.
Figure 2 compares the employment rate of immigrants and native-born workers in OECD countries by education level. High- and medium-educated immigrants have significantly lower employment rates than high- and medium-educated native-born workers in almost all OECD countries. Accordingly, their unemployment and non-employment are significantly higher than for native-born workers in European welfare states. In contrast, employment rates of low-educated immigrants are similar to those of the native-born population. This suggests that the observed occupational degradation is lower than the actual level. It is likely that most non-employed and unemployed immigrants would not have accepted a job below their true occupational level. In other words, a relatively high inactivity rate among higher-skilled immigrants may indicate a significant non-acceptance rate of job offers; i.e. immigrants who have had a lower job offer than their expected level might not have accepted this job offer and may remain inactive. On the other hand, this option is not likely for low-educated immigrants as indicated by a small native-immigrant inactivity gap. For these immigrants, there is little room for a lower job offer. So, their (implicit) non-acceptance rate may not be relatively high.
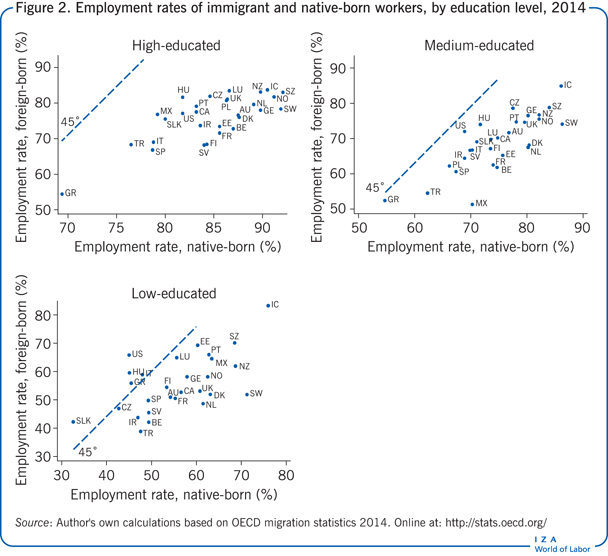
Signaling theory views schooling as a signal to potential employers of unobserved (and observed) ability of job applicants. In that case, because employers would have less knowledge about the quality of foreign education, foreign schooling would be a less adequate indicator of ability than schooling acquired within the host country education system. Thus, because employers are less able to estimate the true productivity of an immigrant worker, they tend to value foreign schooling and experience less than local schooling and experience.
Jobs in high-knowledge and high-technology economies are increasingly high-skilled, requiring sophisticated interpersonal, analytic, and cognitive skills that depend heavily on proficiency in a common language. Productivity is determined not only by formal training but also by imperfectly observable secondary factors such as motivation, work attitude, communication and interaction skills, and teamwork. As it is more difficult to accurately evaluate these characteristics among immigrants than among native-born workers because of different cultural codes and behavioral norms, employers will use stereotypes about the country of origin as a signal of these secondary factors; for example, immigrants from country X are lazy while immigrants from country Y are hardworking and ambitious. That makes it almost inevitable that immigrants will end up in less-skilled occupations that do not align well with their occupational status in their home country. As employers learn more about the productivity of immigrants over time, immigrants will climb higher on the occupational ladder. Some part of the occupational adjustment of immigrants may thus be explained by this bridging of the information gap about true productivity.
Economic theory suggests that the relative degree of income inequality in home and host countries influences the return to skills, the cost of migration, and the skill distribution of migrants. Thus, immigrants from countries where incomes are more unequally distributed than in the host country would be largely lower skilled, while immigrants from countries where income is more equally distributed are more likely to be higher skilled.
This line of reasoning suggests that immigrants to north-western Europe—where welfare systems are more generous and income distribution is more equal—may be lower skilled since the income distribution is more unequal in the immigrants’ home countries than in their host countries. When income distributions are not extremely different, the cost of migration can differentially influence migration decisions across the levels of the skill distribution. Moving costs are related to several comparative factors in home and host countries, such as distance between countries, cultural similarities, common language, and colonial history.
If moving costs are high, only people with better economic prospects in the potential host country will migrate, and their skills will be less valued—that is, they will be over-educated. If moving costs are low because two countries share a common colonial history, including similarities in education system, language, and labor market institutions, a high transferability of skills and a correspondingly better match of skills and jobs would be expected. A common colonial past reduces the likelihood of over-valuation of formal education but does not influence under-valuation of skills. Immigrants from former colonies therefore experience less of a skill mismatch. And low-skilled immigrants can more easily migrate thanks to lower moving costs.
Figure 3 depicts the self-selection of immigrants from the population of home countries. People in the upper percentile of the education distribution in their home countries are more likely to migrate (positive self-selection). These immigrants have potentially high adjustment abilities and, accordingly, would present little burden to the host country. This positive self-selection clearly favors host countries, which do not have to finance the costly education of immigrants while benefiting from their previous education in their home country. In contrast, the home countries of immigrants lose the most able segment of their population (“brain drain”).
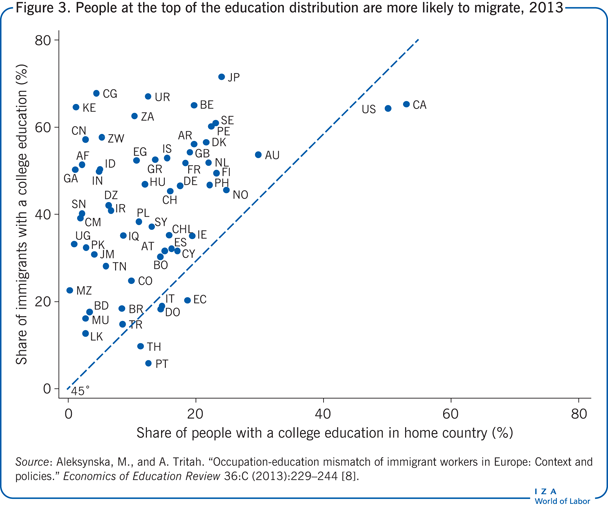
The occupational mobility of immigrants is related to the quality of immigrants in the host country labor market since both formal qualifications and motivation are essential drivers of investment in country-specific capital and occupational mobility. Immigrants’ choice of host country is not random. It is likely influenced by a country’s economic attractiveness and its immigration and integration policies, as well as by the presence of networks of former migrants from the home country, geographic distance, and cultural and linguistic similarities. Common colonial histories also appear to shape the route of migration flows. Many migrants prefer moving to the country that formerly colonized their own because its institutions, education system, social norms, and language are similar to those in the country from which they are migrating. While existing diaspora networks facilitate migration by reducing communication and transportation costs, bilateral similarities provide a solid basis for a high degree of skill transferability. Immigrants in European countries consist largely of four main groups: immigrants from former colonies, immigrants from guest-worker-sending countries, asylum migrants, and labor migrants from other developed economies. A substantial share of immigrants in France, the Netherlands, Spain, and the UK, for example, are from former colonies, such as Suriname, Southeast Asia, North Africa, and Spanish-speaking Latin America. Asylum seekers tend to aim for countries with favorable migration policies and where they have family ties and social contacts.
The model of occupational mobility of immigrants predicts different adjustment patterns depending on the reason for migration. It is often argued that non-economic migrants would have occupations that include a high intensity of home-country-specific skills that are less applicable in host countries, such as teachers in home-country languages, lawyers, and army officers. However, lack of appropriate data has prevented research into differences in adjustment patterns based on migration motive.
Furthermore, the empirical evidence suggesting that proficiency in the dominant host country language is pivotal in determining occupational adjustment comes predominantly from English-speaking countries, such as Australia, Canada, and the US. There is very little evidence on the interactions between languages in European countries and occupational mobility, except for some evidence for Spanish. Recent evidence from Spain suggests that immigrants from Latin America gain little in the Spanish labor market from speaking a common language [9]. Moreover, the role of English in several small Scandinavian countries needs to be assessed in greater detail since it is widely spoken in these countries, and increasingly a language of instruction for many high-skilled occupations.
The literature indicates varying occupational adjustment profiles by home country of immigrants. In general, immigrants from developed economies or former colonies seem to face only a small decline in occupation status and then a small rise as they catch up with native-born workers, while asylum migrants experience a sharp decline in occupational status on entry and do not catch up to their native-born counterparts in education. However, there is no evidence for links between occupational adjustment and the choice of host country based on host country migration policies, social ties, language skills, and the like.
The high economic inactivity rate among immigrants from countries that are very different from the host country suggests that some part of occupational degradation might be masked by the fact that these migrants reject lower-skilled job offers in European welfare states. Occupational mobility of immigrants may also be influenced by selective return migration when less successful immigrants who face the biggest skill degradation or unemployment are more likely to leave the host country.
Immigrants from countries that share fewer characteristics with the host country experience a sharp decline in occupational status followed later by a large increase. The under-valuation of skills has been attributed to the lack of country-specific capital, lack of information, and quality differences in skills. Little is known about the additional impact of legal or implicit restrictions on access to occupations, which may prevent immigrants from transitioning smoothly from their last home-country job to their first job in the host country. In addition to existing discrepancies between the required occupational skill levels in host countries and the occupational skills acquired abroad by immigrants, labor market discrimination may prevent or delay the occupational adjustment. But there is virtually no empirical study on discrimination and its long-lasting effects on the occupational mobility of immigrants.
Finally, there are indications of changes in the skill mix in the home countries and in motives for migration among immigrants moving into Europe. Research needs to examine these changes by monitoring the nature of immigration flows over time. To develop effective policies, an adequate assessment of immigrants’ actual skill endowments and language abilities at the point of arrival is essential.
Evidence suggests that immigrants’ occupational adjustment follows a U-shaped pattern. This pattern is steepest for highly-educated immigrants who come from developing countries that are linguistically and culturally different from the host country and whose migration decisions are driven mainly by humanitarian reasons rather than economic incentives. Language ability appears to be a key variable in predicting the degree of skill transferability in this context. Since an increasing number of jobs require a high level of cognitive skills and interpersonal interactions, language ability is an essential tool for better matching of skills and occupations.
Policies should aim to reduce the information gap that leads to the under-valuing of the formal qualifications and experience acquired abroad relative to the skills required for host-country occupations. Policy interventions can improve transparency in how formal skills and qualifications are recognized and assessed. For instance, the skills and experience required for a vacancy for medical doctors or computer programmers can be clearly described, leaving little room for preferences that often unduly favor native-born workers. In addition, asking recruiters to document the selection considerations used to identify successful applicants, in terms of job requirements and the quality of candidates, can improve recruiters’ performance and enable immigrant job applicants to learn more about weight assigned to various qualifications and employers’ recruitment behavior.
The empirical research provides solid evidence of a decline in the occupational status of immigrants upon arrival, whatever their country of origin. For the most disadvantaged immigrant groups, the effects of this decline are long-lasting. This suggests that the best policy interventions would support newly arriving immigrants in investing rapidly in country-specific capital, including gaining fluency in the dominant language and learning the formal and social codes of relevant occupations.
The author thanks two anonymous referees and the IZA World of Labor editors for many helpful suggestions on earlier drafts.
The IZA World of Labor project is committed to the IZA Guiding Principles of Research Integrity. The author declares to have observed these principles.
© Aslan Zorlu
https://wol.iza.org/articles/immigrants-occupational-mobility-down-and-back-up-again/long
El Ministerio de Trabajo (Mintrab) confirmó que para el salario mínimo del 2022 mantendrá la estructura actual de discusión para fijarlo, pero para el 2023 busca establecer el salario mínimo regional.
La Comisión Nacional del Salario (CNS) y las comisiones paritarias (correspondientes a actividad agrícola, no agrícola y de maquila), iniciaron este año la discusión para la propuesta de fijación del salario mínimo para el 2022, con la misma metodología como se ha hecho hasta el que está vigente. También buscan que quede establecido en primeras semanas de diciembre y no en los últimos días del año, para que los empleadores se prepararen con anticipación.
Sin embargo, para el proceso con el fin de fijar el salario mínimo del 2023 el Mintrab ha propuesto basarse en el artículo105 del Código de Trabajo, el cual establece la creación de Comisiones Paritarias por departamento o circunscripción económica por territorio y propuso a CNS y a las comisiones paritarias actuales constituirlas en esa modalidad.
La viceministra de Administración de Trabajo, María Isabel Salazar, dijo que la primera propuesta es para analizar el salario mínimo de más específica, y en su momento analizó que fueron 22 comisiones paritarias, pero observaron que hay temas de representatividad y operación que lo haría poco viable.
Por ello hicieron dos propuestas:
La convocatoria para las comisiones paritaria por región serían convocadas en enero del 2022.LEA ADEMÁS:

“De esta forma, dichas comisiones discutirían sobre el salario mínimo de la circunscripción que les corresponda, en la actividad económica agrícola, no agrícola y de maquila, durante todo el 2022, los resultados de esa discusión serían tomados en cuenta para la fijación del salario mínimo de esa circunscripción para 2023”, dijo agregó.
Refieren que la normativa laboral vigente lo permite y no ha sido usada a la fecha, por lo que lo ven “como una alternativa que viabilice el desarrollo del país de forma equitativa por medio del análisis y estudio económico relativo al salario”.
Expusieron que no tiene ninguna vinculación con el salario mínimo diferenciado que se pretendió establecer hace años que fijaba salarios mínimos menores a los vigentes, sino que solo se refiere a la forma de análisis, aseguran que tampoco busca reducir el salario mínimo en ningunos de los departamentos o circunscripciones del país.
Lea también: Tiempo parcial en Guatemala: 20 lineamientos para aplicar los contratos por hora
Con respecto al Programa de Trabajo Temporal en el Extranjero, la viceministra de Previsión Social y Empleo, Geovanna Salazar, indicó que en la actualidad se cuenta con 906 plazas laborales por ocupar, correspondientes a 26 empresas en proceso de reclutamiento. Se proyecta enviar 190 personas al final de julio y 422 a finales de agosto.
El ministro, Rafael Rodríguez, se refirió al trabajo de tiempo parcial luego que la Corte de Constitucionalidad le dio luz verde a esa modalidad de contratación la semana pasada. Indicó que toda persona que es contratada a tiempo parcial debe de tener los mismos derechos que una persona que labora a tiempo completo y los contratos deben inscribirse en el Registro Electrónico de Contratos Individuales de Trabajo (RECIT), el cual se encuentra disponible en el sitio electrónico del ministerio.
El funcionario dijo que el Instituto Guatemalteco de Seguridad Social (IGSS) deberá decidir si modifica o deja igual sus programas de servicio a los afiliados. Es obligación el pago de las cuotas a ese ente tanto de trabajadores de tiempo parcial o de tiempo completo.
Si el contrato a tiempo parcial no se registra se tomará como si fuera uno a tiempo completo.

